A Five Year Analysis of Anti-Abortion Violence Trends
Conducted by the Feminist Majority Foundation
Released on January 15, 1998
Jennifer Jackman, Ph.D., Director of Policy and Research
Christine Onyango, M.A., Research Associate
A Five Year Analysis of Anti-Abortion Violence Trends Conducted by the Feminist Majority Foundation
METHODOLOGY
For the fifth consecutive year, the Feminist Majority Foundation conducted a nationwide survey of anti-abortion violence directed at abortion providers. This longitudinal analysis is the most comprehensive study of anti-abortion violence directed at clinics, patients and health care workers in the United States and its territories over the past 5 years. The survey measures violence, harassment, and intimidation during the first seven months of 1997.
In September, 1997, surveys were mailed to the population of 864 abortion providers in the United States. A reminder mailing followed in mid-October, 1997. Follow-up calls were made between mid-October and mid-December. Three hundred and thirty-nine surveys were returned, producing a response rate of 39.2%. Data were analyzed using SPSS-X (Statistical Package for the Social Sciences) uni-variate and bi-variate techniques.
The sample of 339 clinics in the survey includes clinics and doctors’ offices in 49 states and the District of Columbia. (See Appendix A for list of number of surveys completed per state.) The percentage of clinic practice devoted to abortion ranges from less than 5% to over 75%. Facilities in the sample are fairly evenly divided among non-profit (34.2% ), for-profit (37.8%) and doctor’s offices (27.8%). Clinics were members of the National Abortion Federation, Planned Parenthood Federation of America, the National Women’s Health Organization, and the National Coalition of Abortion Providers, and 28.6% respondents were independent and had no national affiliation.
Our survey found that while 50.7% of respondents provide abortion as more than 75% of their practice, almost all abortion providers (95.3%) also provide a variety of gynecological services. Services available at the clinics include contraception (94.1%); emergency contraception (74.3%); prenatal services (21.8%); cancer screening (67%); HIV testing (57.5%); STD testing and treatment (72.6%); vasectomy (19.5%); tubal sterilization (31.9%); services related to menopause (58.7%); and services related to adoption (15.3%).
Medical, non-invasive methods of early abortion were administered at 60 clinics in 1997. A limited number of clinics participating in clinic trials administered mifepristone, known also as RU 486 or the “French abortion pill.” Other clinics began to use the cancer drug methotrexate off-label for early abortion. Both drugs are used orally in combination with the prostaglandin, misoprostol. Of the clinics in the survey, 11 administered mifepristone only, 36 methotrexate only, and 13 both mifepristone and methotrexate.
Clinics responding to the survey were assured that their individual responses would remain confidential. Clinics are identified in this report by name or location only if the incidents and consequences of the violence are a matter of public record or if the Feminist Majority Foundation obtained permission to include the details of the incident in this report.
KEY FINDINGS
Severe violence still plagues about 25% of clinics — only a slight drop from the level of violence in 1996. In the first seven months of 1997, 24.8% of clinics experienced one or more forms of severe violence, for a decline of only 2.8 points from 1996. These forms of severe violence included blockades, invasions, bomb threats and bombings, arson threats and arsons, chemical attacks, death threats, and stalking. Violence levels were 27.6% for the same time period in 1996. But the level of violence at clinics in 1996 and 1997 is down sharply from its high mark of 51.9% in 1994.
Anti-abortion violence is becoming more concentrated among a small number of clinics.The percentage of clinics experiencing high levels (more than 3 types) of violence, harassment, and intimidation has increased slightly since 1996. The number of facilities reporting high levels of violence rose from 7.1% in 1996 to 8.3% in 1997. This increase, though small, reverses the trend from 1993 to 1996 of a steady decrease in the proportion of clinics reporting high levels of violence — from a peak of 22% of clinics in 1994, to 14.2% in 1995, and to 7.1% in 1996.
The percentage of clinics experiencing no violence, harassment or intimidation has doubled over the last four years. In 1997, almost two thirds of clinics reported no violence; only one-third of clinics in 1994 were free from violence, harassment, and intimidation.
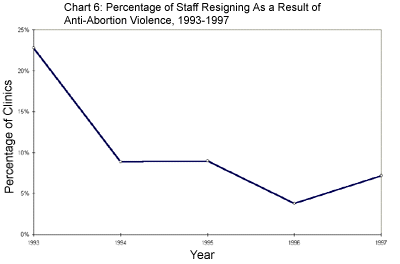
Staff resignations as a result of anti-abortion violence and harassment were up in 1997, reversing the trend toward significant declines in staff resignations in prior years. While 3.9% of clinics reported staff quitting in 1996, 7.1% in 1997 reported physicians, nurses, counselors, lab technicians and/or administrators leaving as a result of clinic violence. One-fourth of clinics in 1993 reported staff resignations as a result of anti-abortion violence.
Vandalism and bomb threats at women’s health facilities were the most common forms of violence in 1997. Of respondents, 22.4% reported various forms of vandalism. One in ten (12.4%) clinics reported bomb threats.
As in previous years, lower levels of violence continued to be associated with better law enforcement response. Of clinics which reported local law enforcement response as “excellent” in 1997, only 7.5% experienced high levels of violence, compared with 35.7% of clinics which characterized local law enforcement response as “poor.”
Clinics reported increases in several severe types of violence between 1996 and 1997. Increases in arson threats to 3.5%, bomb threats to 12.4%, arsons to 1.8% and gunfire to 1.8% occurred for the first time since 1995.
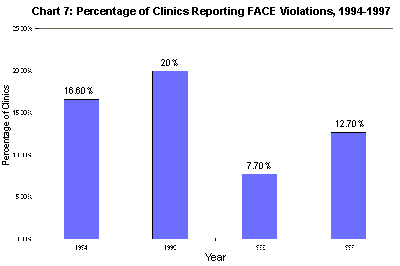
The proportion of clinics which reported FACE violations to federal officials climbed to 12.7% in 1997 — from 7.7% in 1996. FACE reports reached their highest levels in 1995, when 20% of clinics reported FACE violations to federal officials.
Almost one-third of clinics (31%) in 1997 were protected by buffer zones, approximately the same percentage of clinics that had buffer zones in 1996.
As in 1996, free-standing clinics, for-profit clinics, and clinics for which abortion constituted over 75% of their practice were more likely to face severe types of violence.
The majority of clinics (58.7%) were experiencing some form of picketing at their facilities at the time of data collection.
RESULTS
VIOLENCE STILL PLAGUES 25% OF CLINICS — DOWN ONLY SLIGHTLY FROM 1996
The bombings of abortion clinics in Oklahoma and Atlanta in January last year catapulted anti-abortion violence into the nation’s attention in 1997. By year’s end, there had been 13 women’s health clinic bombings or arsons — seventh highest number of abortion clinic bombings and arsons recorded by the Bureau of Alcohol, Tobacco and Firearms since 1982 and more than double the number of arsons and bombings reported for 1996. Moreover, the January, 1997 Atlanta clinic double bombing marks the first time anti-abortion extremists have used a second anti-personnel bomb targeted at rescue and law-enforcement personnel responding to the first bomb. In this instance, several federal law enforcement personnel were injured.
Despite the tragic escalation in bombings and arsons in 1997, the Feminist Majority Foundation’s fifth annual National Clinic Violence Survey found little change in the level of clinic violence between 1996 and 1997. Of the 339 clinics surveyed, 24.8% had experienced one or more types of severe violence in the first seven months of 1997, down slightly from 1996. This measurement of severe violence includes blockades, invasions, stalking, bomb threats, bombings, arson threats, arsons, chemical attacks, and death threats.
Considering that violence dramatically surged immediately after President Clinton’s election in 1992, holding the line on clinic violence levels in a climate of increased anti-abortion frustration and militancy following the 1996 elections is a major accomplishment. The fact that the overall level of violence at clinics remained essentially constant is testimony to the combined vigilance of clinics, pro-choice advocates, and law enforcement. Still one-quarter of clinics experiencing severe violence is an intolerable level of violence and constitutes domestic terrorism. Moreover, our survey indicates a concentration of this terrorism and a focused campaign of attrition intended to close clinics.
Since the Feminist Majority Foundation’s first clinic violence survey in 1993, the segment of clinics under attack has declined from a high of 51.9% in 1994 to 38.6% in 1995, to 27.6% in 1996 and to 24.8% in 1997. Chart 1 shows the percentage of clinics reporting severe violence over last five years in which the National Clinic Violence Survey has been conducted.
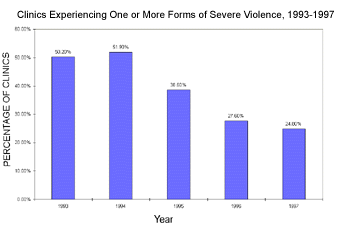
At the same time, the decline in clinic violence which began in 1995 came to a virtual standstill in 1997. At 24.8%, the overall level of severe violence at clinics in 1997 is only 2.8-points less than in 1996, when 27.6% clinics reported incidents of serious violence.
For the fourth consecutive year, our survey also measured additional types of violence, harassment, and intimidation, including gunfire, home picketing, and vandalism. When these three variables are combined with the severe violence variables, the percentage of facilities reporting violence, harassment and intimidation rose to 38.9%. This represents a decrease of 6-points since 1996 when 44.9% of clinics reported these anti-abortion activities.
RESULTS
PERCENTAGE OF CLINICS FREE FROM VIOLENCE GROWS FROM ONE-THIRD IN 1994 TO TWO-THIRDS TODAY
The percentage of clinics experiencing no violence, harassment, or intimidation has doubled over the past four years. In 1997, 61.1% of clinics reported that they had experienced none of the twelve types of violence measured in our survey. In 1994, only 33.3% of clinics were free from violence. In 1995, this figure grew to 44.2% and in 1996 to 55.1%.
Based on these data, we categorized clinics into three levels of violence — those clinics experiencing no violence, those experiencing moderate violence (1 or 2 types), and those experiencing high violence (3 or more types). This analysis, as presented in Chart 2, makes two trends in anti-abortion violence over the past four years extremely clear. First, the strategies of the abortion rights movement — passage of FACE, heightened clinic security, improved law enforcement, and community mobilization — are ending the seige of anti-abortion violence for the majority of clinics. Second, the anti-abortion attack is becoming even more concentrated on a small segment of clinics.
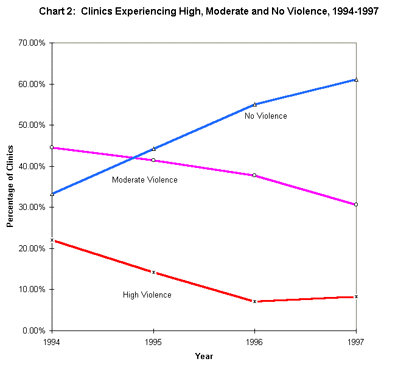
Prior to 1997, there had been a steady decrease in the percentage of clinics reporting high levels of violence. In 1997, this trend reversed for the first time. The 1994 survey found 22% of clinics experienced 3 or more types violence. By 1995, this percentage was down to 14.2% and in 1996 it decreased further to 7.1% . However, in 1997, the number of facilities reporting high levels of violence rose slightly to 8.3%. Clinics experiencing high levels of violence reported their strong concerns about the multiple strategies of anti-abortion harassment, intimidation, and violence they face daily. For example, one clinic administrator described the atmosphere of terrorism at her clinic, which included receiving a continuous flow of threatening letters, having the mail tampered with, the clinic driveways blocked, and having patients intimidated by anti-abortion video cameras. A doctor at another clinic who was stalked in 1997 had in prior years reported being run off the road by anti-abortion activists. In addition, his dog was killed, the wheels on his wife’s car were loosened and his elderly parents received threatening phone calls.
At the same time, the percentage of facilities reporting moderate violence continued a decreasing trend from previous years. In 1994, 44.5% of clinics experienced moderate levels of violence (1 or 2 types). This dropped to 41.5% in 1995 and further to 37.8% in 1996. In 1997, the percentage of clinics experiencing moderate violence dropped 7.1-points to 30.7%.
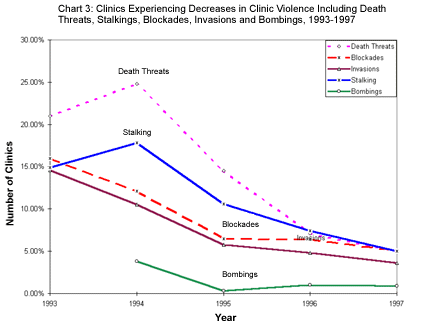
The overall decrease in the percentage of clinics experiencing violence is mirrored in major declines in reports of most forms of serious anti-abortion violence over the last five years. Chart 3 shows that death threats have decreased the most dramatically, from a high of almost 25% in 1994 to 5% by 1997. Stalking was also at its highest point in 1994, with 17.8% of clinics reporting that clinic workers and their families had been stalked. In 1997, 5% of clinics reported stalking. Additionally, reports of blockades and invasions have decreased continuously and significantly since 1993.
Although survey results indicate that clinic violence is a nationwide phenomenon, the states experiencing the most serious violence in 1997 include the following: Alabama, Arizona, California, Florida, Kansas, Michigan, Mississippi, New Jersey, New York, Ohio, Oregon, Texas, and Washington. In prior surveys, Alabama, Arizona, California, Florida, Michigan, New York, Ohio, Oregon, and Texas were among the states that consistently experienced severe violence.
RESULTS
ARSON THREATS, BOMB THREATS, AND GUNFIRE INCREASE; BOMB THREATS AND VANDALISM MOST COMMON FORMS OF VIOLENCE
Although the percentage of clinics experiencing most serious forms of anti-abortion violence has decreased over the last five years, other forms of violence which had shown declines in previous years slightly increased in 1997. Chart 4 shows that small increases were reported for arson threats, bomb threats and arson between 1996 and 1997.
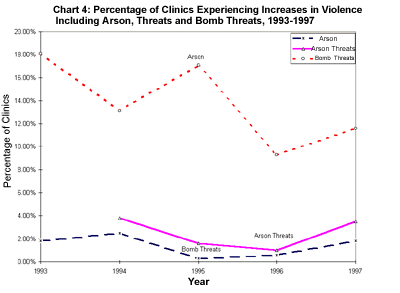
Chart 5 shows the percentage of clinics reporting each type of violence and intimidation. Between 1996 and 1997, reports of most forms of violence and intimidation continued to decline. The largest decline reported was for home picketing, which dropped from 14.01% in 1996 to 8.3% in 1997. Decreases were also reported for death threats which in 1997 were at 5%, stalking at 5%, blockades at 5%, and invasions at 3.6%. Although chemical attacks had risen from 1.0% to 1.6% between 1995 and 1996, they decreased to 0.3% in 1997.
The smallest decline between 1996 and 1997 was reported for vandalism, which at 22.4% in 1997 remained virtually unchanged since 1996. Of clinics reporting vandalism, 15.8% experienced glue in door locks, 14.5% nails in the driveways, .9% motor oil in parking lots, 25% paint on buildings, 26.3% broken windows, 30.3% graffiti, 31.6% tampering with phone lines. Overall, vandalism and bomb threats were the most common forms of violence reported by clinics surveyed in 1997. Bomb threats were reported by 12.4% of clinics. Chart 5 shows violence reports by type for 1997.
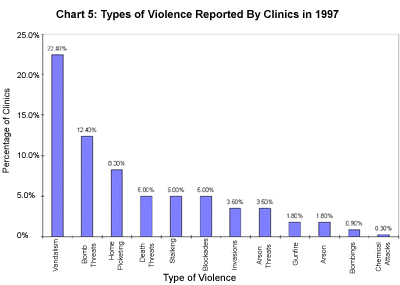
Blockades were reported by 5% of clinics, invasions by 3.6%, and arsons by 1.8%. Bombings were reported by .9% of clinics in our clinic sample. (Please note the survey does not include all bombings and arsons that took place in 1997. Some of the clinics which were the victims of 13 bombings and arsons in 1997 were unable to participate in the survey.)
For the first time, the 1997 survey asked clinics about break-ins and robberies and about the distribution of anti-abortion leaflets targeting particular physicians or clinic workers in the neighborhoods of these clinic employees. Of the clinics, 12 (3.5%) said their clinics or offices had been broken into or robbed during the first seven months of 1997. One in ten clinics (11.8%) reported the distribution of anti-abortion leaflets in the neighborhoods of targeted clinic staff.
For the first time, the survey also measured the number of clinics currently experiencing anti-abortion activity at the time of data collection (as opposed to in the first seven months of 1997). The majority of clinics ( 58.7%) reported current picketing at their facilities. Picketing activity appears to be associated with the percentage of clinic practice devoted to abortion services. Clinics which devoted a higher percentage of their practices to abortion were more likely to experience picketing. Of those clinics which said abortion services accounted for more than 75 percent of their practice, 65.1% reported picketing. Several clinics also commented that in 1997 anti-abortion picketing and sidewalk activity became even more aggressive and virulent.
As another measure of changing levels of violence at clinics, abortion providers were asked to tell us whether occurrences of each type of violence in 1997 to 1996 had increased, remained the same, or decreased at their clinics. For the third consecutive year, most clinics perceived that violence of all types at their facilities had remained at the same level as in the previous year. And, of those clinics perceiving change in the levels of specific types of violence, more clinics reported decreases than increases in every violence category. The greatest net perceived decreases were in blockades, invasions, and chemical attacks. The smallest net perceived decreases were in vandalism and in bombings/bomb threats.
RESULTS
FOR-PROFIT CLINICS, FREE-STANDING CLINICS FACE MORE VIOLENCE
As in 1996, free-standing clinics, for-profit clinics, and clinics for which abortion constituted over 75% of their practice were more likely to face severe types of violence.
Clinics located in free-standing facilities accounted for 66.7% of clinics experiencing severe violence, whereas only 56.5% of the clinics in the survey sample were free-standing. An overwhelming proportion of arsons and arson threats reported in the survey– 100% and 66.7%, respectively — occurred at free-standing clinics.
For-profit clinics also were over-represented among the clinics which were experiencing severe violence. Statistically significant relationships were found between the type of clinic and forms of violence including stalking, blockades, clinic invasions, bombings and bomb threats, and arson and arson attacks. Clinic types included non-profit, for-profit, or private doctors offices. Of the clinics that reported at least one type of severe violence, 52.4% were for-profit, 27.4% were non-profits, and 19% were private doctors offices. Of all the clinics in the survey, 37.8% were for-profits, 34.2% were non-profits, and 27.8% were private doctors offices.
Moreover, invasions, blockades, bombings, bomb threats, vandalism and death threats were more likely to take place at clinics for which abortion constituted more than 75% of their practice.
RESULTS
VIOLENCE-RELATED STAFF RESIGNATIONS UP FROM 1996
During the first seven months of 1997, clinics reported an increase in the number of staff resignations due to anti-abortion violence compared to the previous year. In prior years, clinics had reported a steady decline in staff departures. Chart 6 plots changes in reports of clinic staff resignations related to anti-abortion violence. In 1993, one-fourth of clinics experienced resignations. By 1996, staff quits dropped to a low of 3.8%. However, in 1997, 7.1% of clinics reported resignations as a result of clinic violence, an increase of 3.3 points.
Of the 24 clinics reporting staff resignations as a result of clinic violence in 1997, 4.2% lost a physician (1), 33.3% lost nurses (8), 50% lost administrators (12), 33.3% lost counselors (8), and 20.8% lost lab technicians (5).
The 1997 survey found that the loss of employees in the face of clinic violence corresponded with the quality of law enforcement response. Clinics which rated law enforcement response as “poor” were more likely to experience staff resignations due to anti-abortion violence. Conversely, clinics which reported “excellent” law enforcement response were less likely to report staff quits. This relationship was statistically significant for law enforcement response at the local and state levels.
Of clinics reporting “poor” local law enforcement response to clinic violence, 14.3% had staff quit because of the violence. Of clinics describing local law enforcement response as “good,” 13.5% reported staff resignations. Only 7.5% of clinics which characterized local law enforcement response as “excellent” lost staff.
Over one-third (35.7%) of the clinics reporting “poor” state law enforcement response said they had staff quit because of clinic violence. In comparison, only 7.3% of those describing state law enforcement response as “good” and 7.1% which said state law enforcement response was “excellent,” reported violence-related staff quits.
RESULTS
BUFFER ZONES PROTECT ONE-THIRD OF CLINICS
Approximately one third of clinics (105) in the 1997 survey were protected by buffer zones established either by courts or local governing bodies. Buffer zones prohibit specific forms of disruptive conduct from occurring in a zone surrounding clinics or, in some cases, a zone outside of clinic worker homes. In 1997, the U.S. Supreme Court reaffirmed the use of buffer zones around clinics in Schenck v. Pro-choice Network of Western New York. The Court upheld a 15-foot fixed buffer zone, with the Court making it clear that the permissible size of the zone should be contingent on record of anti-abortion violence and the geographic location of the clinic. The Court had previously upheld buffer zones around clinics in the U.S. Supreme Court’s 1994 ruling in Madsen v. Women’s Health Center . Approximately the same percentage of clinics reported buffer zones in the survey in 1996 as did in 1997.
Over half (54.3%) of clinics with buffer zones had a protected perimeter around the clinics. Of these 57 clinics, the majority had protected zones of less than 25 feet — 22.8% have buffer zones under 10 feet in distance, 31.6% between 10 and 24 feet, 14% between 25-49 feet, and 14% with zones of 50 feet or over.
One in five clinics with buffer zones were protected by buffer zones which specified the permissible level of sound outside of clinics. Six clinics (5.7%) with buffer zones had areas protected around clinic worker homes.
Clinics with buffer zones were more likely than clinics without buffer zones to report that they had experienced decreases in every form of violence. In 1996, clinics reported statistically significant differences in perceived levels of specific types of violence when we compared clinics with and without buffer zones. In 1997, however, the differences in perceived levels of specific violence types were slight and not statistically significant.
RESULTS
ONE IN TEN CLINICS CITE FACE VIOLATIONS
More clinics brought FACE violations to the attention of federal law enforcement officials in 1997 than in 1996. Of the clinics surveyed, 12.7% (43) said that they had informed federal officials of FACE violations during the first seven months of 1997. In 1996, only 7.7% of clinics reported FACE violations. In 1995, the first full year of FACE enforcement, 20% of clinics reported FACE violations. (See Chart 7.)
Of the 43 clinics reporting FACE violations in 1997, 41.9% (18) were provided with clear direction for initiating FACE complaints — the same percentage as in 1996. In 1995, only 16.2% were given clear instructions for pursuing FACE claims.
While there were more FACE reports in 1997 than in 1996 and a similar percentage of clinics felt they had been provided with clear directions for initiating FACE claims, FACE enforcement in 1997 was mixed. Two indices suggest that federal officials were pursuing FACE claims more vigorously. Federal officials were less likely to refer FACE complaints back to local officials for prosecution under local and state laws. In 1996, 50% of clinics who told us they had reported FACE violations related that federal officials had referred them back to local authorities. In 1997, the percentage of clinics told to refer their FACE complaints to local authorities decreased to 37.2% (16). In addition, during the first 7 months of 1997, 41.9% (18) of clinics reporting FACE violations said that federal officials had interviewed involved parties, compared with 29.2% in 1996.
However, other data suggest greater investigation and prosecution of FACE violations continue to be necessary. Fewer clinics in 1997 than in 1996 reported that investigations were opened as a result of their reports, and more clinics than in 1996 said that they were advised that federal authorities would not prosecute. Of clinics reporting FACE violations in 1997, only 20.9% (9) said that investigations into FACE violations had been opened; 25% of clinics reporting FACE violations in 1996 said their reports had resulted in official investigations. In 1997, the number of clinics who had reported FACE violations and were then told that federal officials would not prosecute grew to 14%. Only 8.3% of clinics in 1996 said that they were told that federal officials would not pursue FACE prosecutions.
Only 4.7% (2) of clinics who reported FACE violations in 1997 told us in the survey that federal officials had initiated civil FACE actions. The same percentage of clinics said criminal FACE actions had been initiated as a result of their reports in 1997. Both of these figures represent decreases since 1996 when 12.5% had resulted in civil action and 8.3% of clinics said their FACE reports had produced criminal FACE action.
RESULTS
FEWER CLINICS SEEK LEGAL REMEDIES
At the same time that FACE reports increased, fewer clinics in 1997 sought legal remedies from the courts for clinic violence such as restraining orders, temporary injunctions, and permanent injunctions. During the first seven months of 1997, only 8% of clinics sought legal remedies for clinic violence from the courts. In 1995, 15.2% of clinics sought legal remedies; 10.9% sought legal remedies in 1996. Of the 26 clinics who sought legal remedies during the first seven months of 1997, 14 sought restraining orders, 5 temporary injunctions, and 4 permanent injunctions.
Less than half of the clinics seeking legal remedies actually won. In 1997, 44.4% (12) of clinics which sought legal remedies won, which represents a small increase since 1996 when 41.2% of clinics were successful in obtaining legal remedies. However, in 1995, 46.8% of clinics were awarded court remedies.
In 1997, restraining orders were awarded to 42.6% (6) of the clinics which sought this remedy. Of the clinics seeking restraining orders, 46.2% received them in 1996 and 1995. In 1994, 62.5% of clinics seeking restraining orders won.
Only one of the 5 clinics requesting a temporary injunction was awarded this remedy in 1997. In 1996, one of three clinics seeking temporary injunctions was awarded that remedy. Fifty percent of clinics who sought temporary injunctions in 1995 won those injunctions, and 62.5% of clinics in 1994.
Of the 4 clinics which sought permanent injunctions in 1997, only one clinic received this legal remedy. At 25%, the rate of success in receiving permanent injunctions was the lowest ever. In 1996, 60% of clinics which applied for permanent injunctions received them. The rate was even higher — 72.2% — in 1995.
RESULTS
LAW ENFORCEMENT “EXCELLENT” RATINGS DECLINE SLIGHTLY; DECREASED VIOLENCE REDUCES LAW ENFORCEMENT CONTACTS
Clinic ratings of law enforcement response to clinic violence declined slightly for the second consecutive year. Fewer clinics rated local and state enforcement response as “excellent” than in the previous two years. Federal law enforcement excellent ratings remained constant.
In 1997, 31.6% of clinics rated local law enforcement response as “excellent,” compared to 34.6% in 1996. The percentage of clinics rating state law enforcement response as “excellent” also declined in 1997, with 8.3% of clinics characterizing state response as “excellent” in 1997 compared with 13.5% in 1996. “Excellent” ratings were given by 16.8% of clinics to federal law enforcement response in 1997; federal law enforcement response received “excellent” ratings from 16.7% of clinics in 1996. (See Chart 8.)
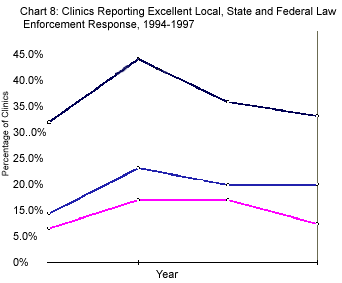
The decline in the proportion of clinics describing law enforcement response as “excellent” did not for the most part produce a concomitant increase in ratings of law enforcement as “poor.” (See Chart 9.) A slight increase in the percentage of clinics calling local law enforcement response poor did occur, with 8.3% of clinics in 1997 recording “poor” local law enforcement response compared with only 6.5% of clinics reporting local law enforcement response as “poor” in 1996. But fewer clinics designated state and federal law enforcement response as poor in 1997 than in previous years. Poor ratings for federal law enforcement declined from 6.7% in 1996 to 4.7% in 1997 and for state law enforcement from 4.8% in 1996 to 4.1% in 1997.
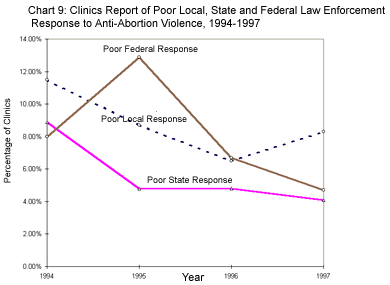
The slight decline in “excellent” ratings may in part stem from decreases in clinic violence in 1996 and 1997 which have reduced the percentage of clinics in contact with law enforcement at all levels. Substantial numbers of clinics indicated “don’t know” when asked about law enforcement response in 1996 and 1997. In 1997, 38.3% of clinics reported “don’t know” when asked to rate local law enforcement response, 75.5% when asked about state law enforcement response, and 61.4% when asked to evaluate federal law enforcement response.
An analysis of the law enforcement response “don’t knows” in the 1997 data confirmed that clinics reporting no violence less likely to be able to characterize law enforcement response. A higher proportion of clinics which indicated “don’t know” to questions about law enforcement response did not experience any violence in 1997 than were represented in the overall sample of clinics. Of those clinics who said they “don’t know” about local law enforcement response, 83.8% had no violence. Of the clinics which said “don’t know” when asked about state law enforcement response, 65.2% reported no violence; 71.2% of clinics who said they did not know about federal law enforcement response also reported no violence. Only 61.1% of clinics in the overall sample did not experience violence.
Arrest levels are a second indication of law enforcement response to clinic violence. Fewer clinics reported arrests for violence committed at clinic facilities in 1997 than in 1996. Of the clinics in the survey, 11.5% reported anti-abortion arrests for these crimes, compared with 15.7% in 1996. Of the 39 clinics noting arrests for violence at clinics in 1997, 31 reported misdemeanor arrests only, 2 reported felony arrests only, and 6 reported both felony and misdemeanor arrests.
The same percentage of clinics reported arrests for anti-abortion offenses away from clinic facilities in 1997 as did in 1996. The percentage of clinics reporting arrests for these crimes was 2.8% in 1996 and 2.7% of clinics in 1997. Misdemeanor only arrests were made at 5 clinics, felony arrests at 3, and one clinic reported both misdemeanor and felony arrests for violence that happened away from the clinics.
Nineteen clinics (5.6%) in the overall sample said criminal charges were filed against anti-abortion violators in 1997. Sixteen clinics (4.7%) reported criminal prosecutions for anti-abortion violence.
Another measure of changes in law enforcement response to clinic violence suggests that local, state, and federal law enforcement response improved slightly in 1997. Local law enforcement received the greatest net gain in response ratings. Eight percent of clinics in the sample said local law enforcement response had improved, compared with 2.7% which said local response had declined. Of the clinics, 5.3% said federal law enforcement response had improved, while 2.7% reported that response at this level had declined. Approximately the same percentage of clinics told us state law enforcement response had improved (2.9%) as told us that state response had declined (2.7%). Most clinics said that local, state, and federal law enforcement response had remained the same.
RESULTS
LOWER LEVELS OF VIOLENCE ASSOCIATED WITH BETTER ENFORCEMENT RESPONSE
- As in prior years, levels of violence correlated with law enforcement response. Excellent law enforcement response was more likely to be associated with no violence or lower levels of violence. Poor law enforcement appeared to be related to higher levels of violence. This relationship was statistically significant for local, state, and federal law enforcement response.
- Of clinics which reported that local law enforcement response to clinic violence was “excellent,” only 7.5% experienced high levels of violence. Of the clinics which said local law enforcement response was “poor,” 35.7% experienced high levels of violence. Clinic evaluation of state law enforcement showed the same pattern, with none of the clinics that had rated state law enforcement response as “excellent” reporting high levels of violence and 28.6% of clinics that described state law enforcement response as “poor” experiencing higher violence levels. The pattern is a little less clear for federal law enforcement response, although the relationship between levels of violence and federal law enforcement response was statistically significant.
- Law enforcement response also correlated with clinic reports of some specific types of violence. This relationship was particularly clear with the local law enforcement response variable. Statistically significant relationships at the p<.05 level were found between local law enforcement response and blockades, invasions, bomb threats, vandalism, stalking, death threats, and picketing at clinics. Statistically significant relationships also were found between state law enforcement response and stalking and federal law enforcement response was associated with picketing at clinics and neighborhood distribution of leaflets targeted at specific abortion providers. Better law enforcement corresponded with fewer reports of these specific types of violence.
CONCLUSIONS
A FIVE YEAR ASSESSMENT OF ANTI-ABORTION VIOLENCE
The Feminist Majority conducted the first National Clinic Violence Survey in 1993 in the wake of the murder of Dr. David Gunn and the dramatic escalation in the intensity of violence at clinics which we had begun to see in late 1992 and early 1993. In 1994, another doctor was murdered as well as a volunteer clinic escort and two clinic receptionists. Death threats and stalking reached all-time highs. In response to this siege of the nation’s women’s health clinics, the pro-choice community mobilized heavily, winning passage of the 1994 Freedom of Access to Clinic Entrances Act (FACE) by Congress, working with clinics to heighten security, and working with law enforcement at all levels to ensure vigorous enforcement of FACE and state and local laws.
Throughout the five years of our National Clinic Violence Survey, an unacceptable number of clinics have continued to experience violence. The number of clinics experiencing severe violence, however, has gone from a high of one half of clinics in 1993 to one fourth in 1997. Anti-abortion violence peaked in 1994, with 51.9% of all clinics reporting severe violence. By 1995, this number had dropped to 38.9%, and, by 1996, the level was 27.6%. In its fifth year, the survey reports the lowest number of clinics experiencing severe violence — 24.8% of clinics in 1997.
Disturbingly, the proportion of the most besieged clinics increased slightly in 1997, for the first time since 1994. The pattern is clear. Anti-abortion violence is becoming more concentrated among a small number of clinics, with a segment of clinics subjected to multiple types of severe violence day-in and day-out. Personnel at these clinics are routinely being threatened, their children stalked, their pets murdered, and their property damaged.
Anti-abortion extremists are waging a national campaign of attrition. This strategy targets one set of clinics and health care workers today. Then, after these clinics perish or the health care workers quit, extremists move on to target another set of clinics. Anti-abortion violence has caused some clinics to close and some clinic staff to quit. Again, the efforts of pro-choice organizations and law enforcement have begun to minimize this outcome. In 1993, 1 in 5 clinics had staff members resign because of clinic violence. Staff quit levels were cut to 1 in 10 in 1994 and 1995, and dropped even further to about 1 in 25 in 1996. We are concerned to see even a slight increase in staff leaving clinics in 1997. Our data have shown consistently that good law enforcement response to clinic violence is key to the retention of clinic staff.
As a result of vigilance on the part of feminist advocates, abortion providers, and law enforcement, anti-abortion violence has significantly diminished in the five-year period of 1993-1997, with an increasing number of clinics reporting no violence. The percentage of clinics experiencing no violence, harassment, or intimidation has doubled over the past four years. In 1997, almost two-thirds of clinics reported no violence; only one third of clinics in 1994 were free from violence.
Tougher penalties resulting from FACE and the increased involvement of federal law enforcement officials as a result of FACE have played an important role in reducing threats to the lives of clinic workers. Death threats which were reported by 24.8% of clinics in 1994 were reported by only 5% in 1997. Similarly, in 1994, 17.8% said clinic workers and/or their family members were being stalked by anti-abortion extremists. The percentage of clinics which report stalking also declined to 5% in 1997.
The annual surveys have shown year after year that law enforcement response is absolutely crucial to the reduction of violence. For several years, our survey has reported on the statistically significant correlation between law enforcement response and most types of violence. Law enforcement response is particularly important at the local level. Our data show, and it makes empirical sense, that clinics interact more with local law enforcement than with federal or state authorities. Since 1995, we have seen improvements in all levels of law enforcement.
Over the past five years, the survey has documented shifts in anti-abortion strategies of violence, harassment, and intimidation. The most significant shift has been away from blockades and invasions at clinics and towards violent attacks and threats directed at abortion providers. Blockades and invasions have continued to decline, largely in response to passage of FACE as well as effective pro-choice strategies of outnumbering protesters and working with law enforcement to keep clinics open. Between 1993 and 1994 — a period in which 6 physicians and clinic workers were murdered — the survey verified the dramatic increase in death threats and stalking, which often have been the precursors to shootings.
Arsons, arson threats, bombings, and bomb threats represent an enduring threat to clinics. In fact, in the wake of the series of anti-abortion bombings in 1997, bomb threats have become one of the most prevalent anti-abortion strategies. In 1997, bomb threats and vandalism were the most common types of violence reported by clinics. The 1997 survey for the first time since 1995 found increases in arson threats, bomb threats, arson, and gunfire. And, these numbers do not even include the clinics bombed or those experiencing arson last year who were unable to participate in the survey.
As stated earlier, FACE has made a major difference in reducing clinic violence. The number of clinics which report FACE violations is an important index of violence at clinics. Even though FACE had been in effect for only five months in 1994 when our second annual clinic was conducted, 16.6% of clinics contacted federal officials about FACE violations that year. The number of clinics reporting FACE violations climbed to 20% in 1995, with one out of five clinics reporting FACE violations to federal officials. Between 1995 and 1996, the number of FACE reports plummeted to 7.7%. In 1997, FACE reports again increased to 12.7% of clinics.
FACE enforcement has shown marked improvement over the law’s three years. Federal officials have responded to clinic reports of FACE violations more aggressively and have become less likely to automatically shift responsibility for dealing with clinic violence to local authorities. Still, a number of possible FACE violations continue without investigation, prosecution, or penalty.
As we conclude our fifth annual National Clinic Violence Survey, we are heartened by the continued decreases in violence, which can be attributed in large part to improved law enforcement, increased security at clinics, and our work and that of our abortion rights colleagues. At the same time, the results of the 1997 survey are in some respects a rude awakening. Increases in the proportion of clinics experiencing multiple types of violence, increases in clinic staff resignations, increases in several types of violence, and slight decreases in local law enforcement response — along with the virtual standstill in the overall level of violence — are a clarion call to the pro-choice community, clinics, and law enforcement that in 1998 we must redouble our efforts to end this reign of domestic terrorism at clinics.
APPENDIX 1
Clinics Responding to the 1997 National Clinic Violence Survey, State By State
- Alabama: 6
Alaska: 2
Arizona: 11
Arkansas: 2
California: 51
Colorado: 8
Connecticut: 9
Delaware: 2
Florida: 31
Georgia: 10
Idaho: 1
Illinois: 9
Indiana: 4
Iowa: 4
Kansas: 4
Kentucky: 1
Maine: 3
Maryland: 7
Massachusetts: 6
Michigan: 14
Minnesota: 3
Mississippi: 3
Missouri: 2
Montana: 3
Nebraska: 2
Nevada: 3
New Hampshire: 3
New Jersey: 7
New Mexico: 3
New York: 19
North Carolina: 8
North Dakota: 1
Ohio: 14
Oklahoma: 1
Oregon: 4
Pennsylvania: 8
Rhode Island: 1
South Carolina: 3
South Dakota: 1
Tennessee: 5
Texas: 20
Utah: 2
Vermont: 4
Virginia: 11
Washington: 14
West Virginia: 1 - TOTAL: 336
APPENDIX 2
State-By-State Analysis of Thirteen States With Highest Levels of Anti-Abortion Violence During the First Seven Months of 1997
- Alabama
One of the six Alabama clinics in the survey was bombed. The West Alabama Women’s Center, sustained $250,000 damage when a firebomb gutted the building’s interior in July. Two clinics received arson threats. One clinic reported that staff members had been stalked. Two clinics reported staff resignations as a result of clinic violence. One clinic was vandalized. Two clinics reported that leaflets had been distributed at staff members’ homes. - Arizona
One of the eleven Arizona clinics received death threats during the first seven months of 1997. Four clinics reported FACE violations to authorities. Three clinics reported staff resignations as a result of clinic violence. One clinic was vandalized. - California
Of the fifty-one California clinics, 2 received bomb threats. One clinic was targeted for bombing in mid-March as a truck loaded with gas cans and propane tanks was driven into the Family Planning Associates Clinic of Bakersfield. One attempted arson was reported and the Family Planning Association Medical Group of North Hollywood sustained $1000 damage from a “Molotov Cocktail” was thrown through a window in early March. One clinic reported a FACE violation to authorities. One clinic reported staff resignations as a result of clinic violence. Two clinics were blockaded. Two clinics were invaded. Once clinic reported a chemical attack. Five clinics reported vandalism. - Florida
Three of the thirty-one Florida clinics received bomb threats. One clinic received an arson threat. Five clinics reported that staff members had been stalked. Two clinics received death threats. Four clinics reported FACE violations to authorities. Two clinics reported staff resignations as a result of clinic violence. One clinic was blockaded. Two clinics were invaded. Six clinics reported vandalism. Two clinics reported that staff experienced home picketing. One clinic was broken into or robbed. Two clinics reported that leaflets had been distributed at staff members’ homes. - Kansas
One of the four Kansas clinics received bomb threats. One clinic received arson threats. One clinic reported that staff members had been stalked. One clinic reported that staff had received death threats. One clinic reported FACE violations to authorities. Two clinics were blockaded. One clinic was invaded. Two clinics reported vandalism. Two clinics reported that staff experienced home picketing. One clinic was broken into or robbed. One clinic reported that leaflets targeting specific clinic staff had been distributed in the neighborhood of these clinic employees. - Michigan
One of the fourteen Michigan clinics received bomb threats. One clinic reported an arson. Three clinics reported that staff had been stalked. Three clinics received death threats. Two clinics reported FACE violations to authorities. Two clinics lost staff due to clinic violence. One clinic was blockaded. One clinic was invaded. Five clinics were vandalized. One clinic reported that staff experienced home picketing. Two clinics reported gunfire. Three clinics were broken into or robbed. Two clinics reported that leaflets had been distributed at staff members’ homes. - Mississippi
Two of the three Mississippi clinics received bombs threats. One clinic lost staff due to clinic violence. One clinic reported vandalism. - New Jersey
Three of the seven New Jersey clinics received bomb threats. One clinic reported FACE violations to authorities during the first seven months of 1997. One clinic reported staff resignations as a result of clinic violence. One clinic was blockaded. One clinic was vandalized. One clinic reported that staff experienced home picketing. One clinic reported that leaflets had been distributed at staff members’ homes. - New York
Six of the seventeen New York clinics received bomb threats. Three clinics received death threats. Three clinics reported FACE violations. One clinic lost staff due to clinic violence. One clinic was blockaded. One clinic was invaded. Nine clinics were vandalized. One clinic reported that staff experienced home picketing. One clinic was broken into or robbed. Two clinics reported that leaflets had been distributed at staff members’ homes. - Ohio
Four of the fourteen Ohio clinics received bomb threats. One clinic reported that staff members had been stalked. Two clinics received death threats. Four clinics reported FACE violations to authorities. One clinic lost staff due to clinic violence. Two clinics were blockaded. Five clinics were vandalized. Four clinics reported that staff experienced home picketing. Four clinics reported that leaflets had been distributed at staff members’ homes. - Oregon
One of the four Oregon clinics received bomb threats. One clinic was bombed. Two Portland clinics sustained damage from arson. The All Women’s Health Services Clinic and the Lovejoy Surgicenter suffered $5000 and $250,000 damage, respectively, from fires set by anti-abortionists. Two clinics reported FACE violations to authorities. Two clinics invaded. Two clinics were vandalized. Three clinics reported that staff experienced home picketing. One clinic reported that leaflets had been distributed at staff members’ homes. - Texas
Four of the twenty Texas clinics received bomb threats. Two clinics reported arson attempts. Three clinics reported that staff members had been stalked. One clinic received death threats. Two clinics reported FACE violations to authorities. Two clinics lost staff due to clinic violence. One clinic was blockaded. One clinic was invaded. Five clinics were vandalized. Three clinics reported that staff experienced home picketing. One clinic reported gunfire. Two clinics were broken into or robbed. Three clinics reported that leaflets had been distributed at staff members’ homes. - Washington
One of the fourteen Washington clinics received bomb threats. One clinic reported an arson. Two clinics reported attempted arsons. One clinic received death threats. Three clinics reported FACE violations to authorities. One clinic was blockaded. Four clinics were vandalized.