Feminist Majority Foundation
For the second year, the Feminist Majority Foundation concluded a nationwide survey of anti-abortion violence in the United States. The survey collected data on acts of violence targeted at clinics and health care workers during the first seven months of 1994 and following the July 1994 murders of Dr. John Bayard Britton and his escort, James Barrett, in Pensacola, Florida. In September of 1994, surveys were mailed to 819 clinics. Follow-up calls were made to these clinics and, in some cases, survey responses were obtained via phone interviews. Between September 15 and November 30, surveys were completed and returned by 314 clinics for a response rate of 38.3%. Data was analyzed using SPSS-X (Statistical Package for the Social Sciences) uni-variate and bi-variate statistical techniques.
This survey represents one of the most comprehensive studies ever conducted on anti-abortion violence directed at clinics, patients, and health care workers. The 1993 clinic violence survey included 281 clinics out of 966 for a response rate of 29.1%.
The 1994 sample of 314 clinics included facilities in 46 states, the District of Columbia and Puerto Rico. (See Appendix a state-by-state breakdown of clinics that responded) The percentage of clinic practice devoted to abortion ranged from under 5% to over 75%. The survey results show 42.4% of the clinics were for-profit institutions, 33.4% were non-profit clinics, and 23.9% were private practices. Almost all of these clinics provided a wide range of gynecological and other health care services in addition to abortion.
Clinics responding to the survey were assured that their individual responses would remain confidential. Clinics are identified by name or state only if the incidents and consequences of the violence are a matter of public record or if the Feminist Majority Foundation was given permission to include the details of the incident in this report.
Anti-Abortion Violence Unabated in 1994
“We have been confronted and attacked more violently than ever. Protesters stalk our physicians, staff, and patients, slash their tires, vandalize their cars, write and call in death threats.”
–Testimony by Susan Hill, President, National Women’s Health Organization, before Subcommittee on Crime and Criminal Justice, U.S. House of Representatives, September 21, 1994
Violence against clinics and health care workers continued unabated in 1994. Of the clinics surveyed, 51.9% experienced one or more types of violence in the first seven months of 1994, compared with 50.2% of clinics surveyed during the same period in 1993. These forms of violence included death threats, stalking, chemical attacks, bombings and bomb threats, invasions, arson and arson threats, and blockades.
As Table I shows, 27.4% (86) clinics experienced one type of violence, 15.6% (49) were the targets of two types of violence, 6.7% (21) of clinics reported three types of violence, and 2.2% (7) experienced four or more types of violence.
Table 1: Clinics Experiencing One or More Types of Violence, 1993 and 1994.
When additional types of violence were assessed in the 1994 survey, the numbers of clinics experiencing multiple types of violence rose significantly. Of the 314 clinics included in the study, 66.7% experienced one or more forms of violence after additional variables of home picketing, vandalism, and gunfire were measured. While 24.8% (78) experienced one form of violence, almost half of the clinics (42%) that responded to the survey were subjected to multiple forms of violence during the first seven months of 1994. Reporting two or more forms of violence were 19.7% (62) clinics; 12.4% (39) were subjected to three types of violence; 5.4% (17) were subjected to four types of violence; 2.5% (8) were subjected to five types of violence; and 1.9% (6) clinics were subjected to six or more types of violence. (See Table 2).
Table 2: Clinics Experiencing One or More Types of Violence, including Gunfire, Home Picketing, and Vandalism, 1994.
Violent acts against clinics and health care workers were not limited to specific states or regions of the country. The survey reveals especially severe anti abortion violence in California, Florida, Illinois, Indiana, Michigan, Missouri, New York, North Carolina, Pennsylvania, Texas, Virginia and Wisconsin. (See Appendix B.) High levels of violence also were reported in Arkansas, New Hampshire, Oregon, and Vermont. Anti-abortion violence in these states is not prohibited because of confidentiality concerns stemming from the small number of clinics in these locations.
Death Threats Most Frequently Reported Type of Violence
Death threats were the most frequently reported type of violence in 1994. Almost one-quarter (24.8%) of clinics reported that staff members had been subjected to death threats during the first seven months of 1994.
Home picketing and stalking followed death threats as the types of violence most often experienced by clinic staff. Twenty-two percent (69) of clinics reported that their staff members were picketed at home and 17.8% (56) reported stalking.
Clinics sustained many other forms of violence at the clinic sites: 12.1% (38) of all clinics reported being subjected to blockades; 10.5% (33) were invaded; 13.1 % (41) received bomb threats; 3.8% (12) were bombed; 3.8% (12) received arson threats; 2.5% (8) sustained losses due to arson; 3.2% (10) were chemically attacked; and 1.9% (6) were the targets of gunfire. (See Table 3).
Table 3: Violence By Type During First Seven Months of 1994.
Vandalism also plagued clinics during the first seven months of 1994. Of the clinics surveyed, 34.8% reported acts of vandalism directed at their clinics. Vandalism included glue put in the locks of clinic doors, nails placed in clinic driveways and parking lots, paint on walls, broken windows and other incidents intended to destroy or deface clinic property or to interfere with the provision of services at the clinic. Additional acts of vandalism included tearing down and defacing signs and other clinic property, spilling water on walkways in order to freeze them during winter months, spreading tar in clinic parking lots, and scratching or “keying” staff cars.
Death Threats Increase Since 1994: Blockades, Invasions, Home Picketing and Chemical Attacks Decrease
Our survey found that during the first seven months of 1994 anti-abortion extremists have reduced blockades, invasions, home ticketing, and chemical attacks in favor of more violent strategies in comparison to the similar time period in 1993. The most personally threatening form of violence directed at clinic staff — death threats — increased significantly in 1994. At 14% (44) clinics, staff reported an increase in death threats compared with the first seven months of 1993. Only 4.8% (15) clinics felt that death threats had decreased. Almost half of the clinics (46.2%) reported that the level of death threats had remained the same. Death threats were the only type of violence for which clinics reported a greater increase than decrease. (See Table 4).
Table 4: Percentage of Clinics Reporting Increases and Decreases in Violence During First
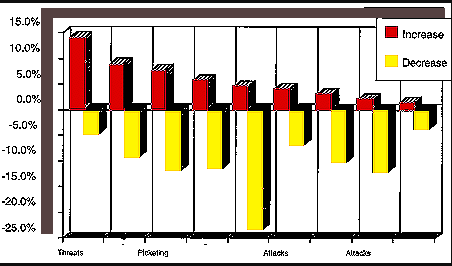
Blockades were the strategy which the highest number of clinics reported had decreased between the first seven months of 1993 and the first seven months of 1994. Twenty-three percent of clinics (73) experienced a decline in clinic blockades. This decrease in the use of clinic blockades can, in part, be attributed to the increasing effectiveness of abortion rights strategies to prevent blockades. Only 4.5% (14) of the clinics surveyed reported an increase in clinic blockades; many other clinics 49.4% (155) reported that the level of clinic blockades remained the same since 1993.
Of the clinics surveyed, 9.2% (29) reported a decrease in stalking, 46.5% of clinics said that the amount of stalking had remained the same, and 8.9% (28) reported that stalking had increased since 1993. Home picketing, another form of violence directed at staff members, was reported by 11.8% (24) of the clinics as having decreased. Almost half of the clinics, 47.5% (149) reported that home picketing stayed the same and 7.6% (24) reported an increase.
Violence directed at clinic buildings and property also experienced net decreases during the first seven months of 1994. Since 1993, 11.5% (36) of clinics reported a decrease in bombings, while 5.7% (18) clinics reported an increase in bombings. An even 50% reported that the level of bombings remained the same. Of the clinics, 6.7% (21) reported a decrease and 4.1% (13) clinics reported an increase in arson attacks; 49.7% (156) of the clinics reported that the level of arson attacks remained the same.
Since 1993, clinics reported decreases in invasions, chemical attacks and gunfire. According to the survey results, 10.2% (32) reported a decrease in invasions, while 50% (157) said that invasions stayed the same and 2.9% (9) clinics reported an increase in invasions. Decreases in chemical attacks since 1993 were reported by 12.1 % of clinics, with 1.9% (6) clinics reporting increases and 48.1% (151) of clinic saying the level of chemical attacks had stayed the same. Incidents of gun fire decreased at 3.8% (12) clinics and rose at 1.3% (4) clinic. Slightly over half (51%) of clinics surveyed reported that in 1994 the level of gunfire incidents had stayed the same.
Law Enforcement Response Improves, Increases in Violence Related to Poor Law Enforcement Response
“Local police will not arrest picketers — [it] is up to clinic staff/clients/escorts. [The] excuse given by local police is that ‘we’ are the victims and so we must do [a] citizen’s arrest!”
–Clinic Director, 1994 Clinic Violence Survey
Our 1994 survey examined local, state, and federal law enforcement response to clinic violence during the first seven months of 1994. The survey also asked clinics to compare violence during this period in 1994 with violence over the same period in 1993. A final set of questions examined enforcement of the Freedom of Access to Clinic Entrances Act during its first five months in force.
In May 1994, President Clinton signed the Freedom of Access to Clinic Entrances Act into law. The Act, which provides federal criminal and civil penalties for acts of force, the threat of force, and acts of physical obstruction targeted at those providing or seeking to obtain abortion services, was passed by overwhelming majorities in both the House and the Senate in November of 1993.
In addition to the FACE victory, abortion rights advocates prevailed in two major U.S. Supreme Court decisions in 1994. In NOW v. Schiedler, the Court ruled in January that anti-abortion terrorists could be sued under the Racketeer Influenced and Corrupt Organizations Act (RICO). In Madsen v. Women’s Health Center the Court upheld the constitutionality of “buffer zone” injunctions created by a state court to protect clinics.
These legislative and litigation victories, along with the concerted efforts of abortion rights advocates urging prosecution of anti-abortion extremists, may have improved law enforcement response to clinic violence. Overall the majority of clinics described the response of local, state, and federal law enforcement officials to clinic violence during the first seven months of 1994 as “good” or “excellent.” However, clinics that experienced moderate to high levels of violence were much more likely to characterize local, state, and federal law enforcement’s response to complaints and incidents of violence as “poor. “
When asked to characterize the response of law enforcement agencies during the first seven months of 1994, over one-third (35.4%) of the clinics ranked local law enforcement response as good,” with 30.3% reporting an “excellent” response and 11.5% experiencing a “poor” response; 22.9% of clinics were unable to characterize local law enforcement response.
Clinics had less contact with state and federal law enforcement officials, but the actions of these authorities still elicited a more positive than negative response. Of the clinics surveyed, 7.3% reported an “excellent” response from state law enforcement and 15.9% labeled state law enforcement response as “good;” 8.9% of clinics said state response was “poor.” Two-thirds (67.8%) of clinics could not describe state law enforcement response and reported “don’t know” on the survey. Slightly under two-thirds of clinics (60.2%) also could not ratefederal law enforcement response, while 10.5% said federal law enforcement response was excellent,” 21.3% said federal response was “good,” and 8% reported a “poor” response.
The majority of clinics reported that local, state, and federal law enforcement response had either improved or remained the same since 1993, with the greatest increases in responsiveness coming from local and federal officials. Close to half of -clinics (46.8%) reported that local law enforcement response remained the same in 1994, with 30.3% reporting improved response and 2.9% saying that response had declined. One-quarter (25.5%) of clinics said federal law enforcement response had remained the same, while 22.9% said federal response had improved and 1.3% reported the response had declined. Over one-quarter of clinics recorded that state law enforcement response had remained the same, with 14.6% reporting an improvement and 2.5% a decline in state response.
Law enforcement response improved since the July murders, but most clinics continued to rely on local rather than federal law enforcement involvement. Fifty eight percent of clinics reported increased sensitivity on the part of local law enforcement, with 4.1% experiencing decreased sensitivity, 24.8% no interaction, and 13.1% not answering the question. While fewer clinics interacted with the Federal Bureau of Investigation (FBI), 34.7% reported increased sensitivity on the part of the FBI, 1.3% decreased sensitivity, and 53.2% reported no FBI interaction in the aftermath of the July murders. A similar pattern prevailed in regards to Federal Marshals. Of the clinics, 60.5% reported that they had no interaction with federal marshals, but 28.3% of clinics reported increased sensitivity on the part of marshals and 1% reported decreased sensitivity.
The importance of effective law enforcement is underscored by 1994 findings showing that the commission of certain violent acts is related to law enforcement response at local, state, and federal levels. Clinics that reported poor local law enforcement response were more likely than clinics that reported an excellent or good response to experience death threats (44.4%), stalking (36. 1 %), home picketing (44.4%), and blockades (30.6%). Of the clinics reporting poor federal law enforcement response, 48% faced death threats, and 52% had staff members who were picketed at home. Clinics that experienced poor state law response were more likely to face blockades (23.7%). Clinics that reported excellent state law enforcement response were more likely not to have had either bomb threats or bombings (82.6%) or arson threats or arson (78.3%) during the first seven months of 1994.
In addition, a statistically significant correlation was found between clinics who experienced higher levels of violence and the characterizations of local, state and federal law responses “poor. ” Fifty percent of clinics experiencing high levels of violence (3-6 types) characterized local law response as “poor” as did 47.2% of clinics experiencing moderate levels of violence (1-2 types). Only 2.8% of clinics experiencing no violence reported a “poor” response on the part of local law officials.
Of the clinics that experienced no violence, 7.1 % rated state law officials as responding poorly to complaints of clinic violence. Over half of the clinics (57.1%) that experienced moderate levels of violence characterized state law response as “poor” and 35.7% of those clinics that experienced high levels of violence characterized the response rate as “poor.”
Although the correlation between violence and a poor response was not as strong on the state level, it was once again apparent on the federal level. Forty-eight percent of all clinics that experienced high levels of violence characterized federal law enforcement as “poor,” 40% of those clinics that experienced moderate levels of violence agreed and 12% of clinics that experienced no violence also characterized the response of federal law officials as poor.
One clinic administrator made a direct connection between active federal officials who operated on the local level and the lack of violence at her clinics, “[This clinic] has not experienced any violent activity this year; however, the local FBI agent has contacted us numerous times and has emphatically stated that her office, the Federal Marshals, and the U.S. Attorney for this district are closely monitoring anti-choice activities.”
To combat violence clinics often were forced to turn to the courts for protection. Legal remedies were sought by over one-fifth (21 %) of the clinics during the first seven months of 1994. Five of the eight clinics seeking temporary injunctions received them. Yet permanent injunctions were granted to only 27.8% of the eighteen clinics seeking this form of relief. Of the sixteen clinics that sought restraining orders, 68.8% obtained them. Clinics experiencing multiple types of violence were most likely to seek legal remedies. Almost half (48.8%) of clinics that faced four or more types of violence sought legal remedies. Of clinics reporting three types of violence, 41.7% sought legal remedies, and 31.5% of clinics experiencing two types of violence sought legal relief.
FACE Enforcement Inadequate
“On June 10, 1994, Paul Hill decided to step up his protests by trying to prevent patients from entering the [Pensacola Ladies Center] Clinic Property and screaming into Clinic windows. Since the FACE bill had been signed into law by the President the week before, I wanted him arrested under that law. Our local police had no guidelines for such an arrest. I then telephoned the local office of the ATF [Bureau of Alcohol, Tobacco and Firearms] to ask who had the authority to make such an arrest and was referred to the FBI and explained what had happened; they sent out an agent. The agent said he would “take down the information,” but could not make an arrest as he had no guidelines…. I decided to go to the top. I telephoned the Justice Department, Attorney General Janet Reno’s office, and after two explanations, was put in touch with Kevin Forder in the Civil Rights Division. I explained who I was, what had happened, and what I was seeking. Mr. Forder informed me he was familiar with the Clinic and Paul Hill’s activities; but this was not the time to arrest him. He said, ‘These problems have always been a local police problem, and would continue to be so…”
— Linda Taggart, Clinic Administrator, Testimony before a hearing of the Subcommittee on Crime and Criminal Justice, September 21, 1994
During the first five months after FACE was enacted, 16.6% (52) of the clinics sampled reported FACE violations. The majority of clinics that reported FACE violations were non-profits (42.3%), followed by for-profit clinics (28.8%) and private doctor’s offices (26.9%).
Federal officials rarely chose to pursue FACE claims themselves, instead directing clinics to seek assistance from local law enforcement or to pursue claims on their own. One quarter of the clinics that identified a FACE violation to federal law enforcement officials were either told that federal authorities would not prosecute or were directed to turn to local law enforcement officials for relief. (See Table 7.) Moreover, even though 55.7% (29) of clinics reporting FACE violations were visited by federal authorities, these visits rarely resulted in the filing of formal charges under FACE.
Table 7: Federal Law Enforcement Response to Clinics Reporting FACE Complaints

To date, only two FACE prosecutions have been sought by federal authorities. Blockaders were charged and convicted in November under FACE for physically obstructing the entrance to a clinic in Milwaukee, Wisconsin. Paul Hill was convicted of the murders of Dr. Britton and James Barrett and the attempted murder of June Barrett under FACE.
In responding to questions about FACE enforcement in the survey, one clinic director reported that, “[Since passage of FACE there has been] little change in response by local law enforcement. They don’t appear to know how to handle complaints and are awaiting their legal department’s “interpretation” of FACE law. Another particularly besieged clinic administrator reported that over the course of the first seven months of 1994 her facility experienced blockades, invasions, bomb threats and bombs, arson and arson threats and chemical attacks. Her staff was picketed at home and staff members received numerous death threats. When the administrator contacted federal law enforcement officials in order to report potential FACE violations, she was referred back to local authorities whose previous responses to requests for assistance was minimal.
Inadequate enforcement of FACE was a central concern expressed at oversight committee hearings of the Subcommittee on Crime and Criminal Justice of the House Judiciary Committee held on September 21, 1994. At those hearings, clinic workers detailed continuing anti-abortion threats and harassment and the lack of federal response to possible FACE violations.
At the hearing, a four-member panel comprised of a physician, a clinic owner, a police sergeant and a clinic administrator related numerous incidents of anti-abortion violence and intimidation that law enforcement officials did not pursue as FACE violations. Susan Hill, President of the National Women’s Health Organization, which owns nine abortion clinics across the country, testified that neither local nor federal law enforcement officials were making arrests under FACE.
Death threats, in particular, have not been dealt with by federal authorities even though FACE expressly prohibits the use or threat of force in connection with the provision of abortion services. While this survey shows that the number of clinics reporting death threats has climbed dramatically, FACE charges have not been instituted against anti-abortion extremists issuing direct death threats to specific health care providers.
One in Ten Clinics Lost Staff: But Staff Losses Less Than 1993
In comparison with 1993 survey data, fewer clinic staff members quit during the first seven months of 1994 as a result of violence<. In 1994, 8.9% of clinics (28) lost employees as a result of violence and intimidation. Last year, almost one-third of the clinics who responded reported that a staff member had resigned for this reason.
Clinics in 1994 experienced the resignation of physicians, nurses, and administrative personnel. In one-quarter of these clinics, the staff member who resigned was a physician, 42% of those who resigned were nurses and 32% were administrators or staff assistants. Some clinics experienced multiple resignations as in the case of one clinic which, since January 1994, had to replace a physician, a nurse and two administrative assistants.
Other Health Services Disrupted at Clinics: 92.4% of Clinics Provide Services In Addition to Abortion
Anti-abortion violence not only has limited access to abortion, but also has prevented patients, particularly low-income women and their families, from receiving a wide range of other important health care services. Of the clinics that responded to the survey, almost all (94.9%) reported that they provided services in addition to abortion.
Most clinics (92.4%) provided birth control. Other services included cancer screening, provided by 69.7% (219) clinics; menopause counseling and treatment, provided by 50.3% (158) clinics; PMS counseling and treatment, provided by 49.7% (156) clinics; tubal ligation, provided by 35.7% (112) clinics; infertility counseling and treatment, provided by 27.1% (85) clinics; pre-natal care, provided by 26.1% (82) clinics; adoption and related services, provided by 23.9% (75) clinics; and vasectomies, provided by 16.2% (5 1) clinics. (See Table 5).
Table 5: Other Services Avaiiable at Women’s Health Care Clinics, 1994.
Many clinics reported providing a range of additional services such as testing and treatment for sexually transmitted diseases, HIV testing, drug screening, marriage physicals, vaccinations, yearly gynecological exams, donor insemination, pregnancy testing and informational services such as workshops, seminars and forums on issues relating to women’s health. Clearly, the great majority of women’s clinics provide an important range of critical health services.
Death Threats Rise Since July 1994 Pensacola Murders
“…we will see the beginning of massive killing of abortionists and their staffs.”
–David C. Trosch, “Justifiable Homicide,” Letter addressed to the U.S. Congress, July 16, 1994.
One grim statistic not covered by the survey is the number of killings and clinic personnel shootings since 1991. In 1991 two clinic workers were shot at a Springfield, Missouri clinic. One worker was paralyzed from the waist down, the other was wounded in the stomach. In 1993, Dr. David Gunn was killed outside a clinic in Pensacola, Florida, Dr. George Tiller was shot outside of his clinic in Wichita, Kansas, and Dr. Wayne Patterson was killed in Mobile, Alabama. This year, Dr. John Bayard Britton and his escort James Barrett were killed in Pensacola. June Barrett, James Barrett’s spouse, survived gunshot wounds. The tactic of shooting doctors has spread to neighboring countries. In November, Dr. Garson Romalis was shot while eating breakfast in his home in Vancouver, Canada.
Furthermore, the shooting spree which resulted in the death of Dr. Britton and Barrett was not a random event. Murdering doctors has become an accepted tactic by some extremists in the anti-abortion movement. Last year a declaration signed by over 30 anti-abortion extremists outlined their position of “Justifiable Homicide” against practitioners of abortion. Britton and Barrett were murdered by petition author, Paul Hill, who attempted to use the justifiable homicide defense in court during his murder trial.
The death of James Barrett and the attempted murder of June Barrett shows that even those who provide protection for doctors are also at risk. In an open letter to the United States Congress, David Trosch, a Catholic priest and strong advocate of justifiable homicide, warned that those persons connected with abortion-providing doctors are also at risk of becoming targets for anti-abortion extremist activity.
The murders of Britton and Barrett appear to have escalated death threats against clinic personnel. The survey measured increases in types of violence following the July 29th Pensacola murders. Since July, 16.6 % (52) clinics reported an increase in death threats. This statistic is especially striking when placed in the context of other types of violence. Only 5.4% (17) of the clinics reported an increase in stalking; 2.9% (9) reported an increase in bomb threats, 2.9% (9) reported an increase in blockades, 2.2% (7) reported an increase in bombings, 1.9% (6) reported an increase in arson threats, 1.6% (5) reported an increase in clinic invasions, 1.3% (4) reported an increase in arson, and .3% (1) reported an increase in chemical attacks. (See Table 6).
Table 6: Percentage of Clinics Reporting Increases in Violence by Type Since July 1994 Pensacola Murders
In addition to the rise in death threats after the July murders, another alarming pattern emerged. Our data analysis found a statistically significant correlation between violence and clinic status since the murders of Britton and Barrett. Clinics were asked to assess anti-abortion violence following the July 29th murders. From July 29 through the Fall of 1994, the survey found that non-profit clinics — which often are more economically vulnerable — were targeted by anti-abortion violence. Some of the most threatening acts of violence were perpetrated against staff and buildings at non-profit clinics: 40.4% of clinics that reported death threats, 52.9% of clinics that reported stalking and 71.4% of clinics that reported bombin2s were nonprofits. (See Chart 1). Chemical attacks, blockades and invasions, however, appear to be more prevalent at for-profit clinics and private doctor’s offices.
Some clinics that experienced little anti-abortion violence in 1993 or early in 1994 suddenly found themselves besieged by violence and threats after the July murders. In Vermont, for example, one bombing was the only form of violence during the first seven months of 1994 reported by the seven clinics participating in the survey. But since the murders, four Vermont clinics recorded increases in bombings, bomb threats, and arson threats.
Furthermore, anti-abortion violence since July was not limited to clinics and doctors who provided abortions. Although not included in the final results of the survey, some non-abortion providing clinics reported incidents of anti-abortion violence. Clinics in Falls Church, VA; Brainerd, MN; Cloquet, MN; Sydney, OH; and St. Albans, VT, and Rapids City, SD were fire bombed after July 29, 1994. Only one arrest has been made (in the Vermont incident), and no FACE charges have been filed. With the exception of the Virginia facility all of the clinics provided family planning, and none provided abortions. As in the past, anti-abortionists are not limiting acts of terrorism to abortion-providers.
Summary
The 1994 Feminist Majority Foundation’s Clinic Violence Survey revealed that anti-abortion violence during the first seven months of 1994 continued to plague the lives of health care workers who provide abortion services. The key findings of our survey include:
- violence directed at abortion clinics and health care workers remained at essentially the same high levels as in 1993;
- anti-abortion extremists are increasingly turning to death threats as their primary strategy;
- blockades, invasions, chemical attacks and home picketing decreased since 1993;
- following the murders of Dr. Bayard Britton and clinic escort James Barrett, death threats escalated;
- fewer clinic staff resigned this year than in 1993 as a result of anti-abortion violence;
- increases in clinic violence are related to poor law enforcement response; and
- law enforcement response to clinic violence generally has improved, but enforcement of the 1994 Freedom of Access to Clinic Entrances Act during its first five months has been limited.
Of the clinics surveyed, 51.9% experienced one or more types of violence, including death threats, stalking, chemical attacks, bombings and bomb threats, invasions, arson and arson threats, and blockades. Last year, 50.2% of clinics reported one or more of these types of violence. When additional forms of violence such as home picketing, gunfire, and vandalism were considered this year, 66.7% of clinics reported one or more types of violence.
Death threats were the most frequently reported type of violence. Of the clinics, 24.8% indicated that members of their staff had received death threats. More clinics reported that death threats had increased since 1994 than any other form of violence; 14% of clinics experienced an increase in death threats during the first seven months of 1994. Death threats again increased significantly after the July slayings in Pensacola; 16.6% of clinics reported an increase in death threats after the murders of Dr. Britton and Barrett. Moreover, the survey found that death threats were directed at non-profit clinics, which are generally more economically vulnerable, in significantly higher numbers than at for-profit clinics or private doctor’s offices.
Anti-abortion violence resulted in fewer clinic staff resignations in the first seven months of 1993 than in 1994. Of clinics responding to the 1994 survey, 8.9% had at least one staff member quit because of clinic violence, compared with one-third of clinics in 1993.
The survey found that clinic violence imerils not only abortion access, but also a wide ranize of low-cost health care services. Of the clinics in the survey sample, 94.9% provide services in addition to abortion such as cancer screening, birth control, infertility treatment, vasectomies, tubal ligation, and adoption services.
The survey also measured the responses of local, state, and federal authorities to reports of anti-abortion violence. Enforcement of the Freedom of Access to Clinic Entrances (FACE), an act passed by the U.S. Congress to protect clinics from anti abortion violence, during the first few months since its enactment was extremely imited. Fifty-two clinics reported FACE violations to law enforcement officials. One quarter of these clinics were told that federal officials would not prosecute under FACE or were directed to local law enforcement agencies. Many of these clinics said that law enforcement response was inadequate even when their reports of FACE violations elicited visits from federal law enforcement officials and clear directions on how to pursue FACE claims.
In the wake of recent U.S. Supreme Court decisions upholding clinic buffer zones and allowing clinics to sue under federal conspiracy laws, and after FACE passage, clinics reported some improvement in the response to clinic violence by local, state, and federal law officials. The survey also found that clinics did not often seek assistance from state and federal authorities. Clinics relied primarily on local law enforcement for assistance in contending with anti-abortion extremist activities. Yet local authorities were the most unlikely or unable to provide adequate protection for clinics.
Poor law enforcement response, in fact, appears to have a direct relationship to violence at clinics. Statistically significant relationships were found between law enforcement response and changes in the level of specific types of violence since 1993.
The following sections examine important findings from the 1994 survey related to the types and levels of anti-abortion violence, the rise in death threats, clinic staff losses, the disruption of women’s health services, anti-abortion violence since the July murders, and law enforcement effectiveness.
Conclusion
In 1994, death threats against health care workers providing abortion services reached an all-time high. Death threats were the most frequently reported type of violence, the form of violence that most increased since last year’s survey, and the type of violence that increased the most seriously after the July 1994 murders of Dr. Britton and James Barrett in Pensacola, Florida. Other forms of violence experienced some decrease in 1994. But overall clinic violence continued unabated: over half of clinics in the survey reported one or more forms of violence.
Unless law enforcement officials at local, state, and federal levels improve efforts to prosecute the perpetrators of this violence, anti-abortion extremists will continue to terrorize clinic staffs. Clinic services, which include a wide range of gynecological and other treatments in addition to abortion, will continue to be disrupted.
The survey findings illustrate that law enforcement response is correlated with the commission of certain acts of clinic violence. In other words, poor law enforcement response creates a climate in which anti-abortion violence flourishes. Conversely, effective law enforcement response prevents the escalation of violence at clinics.
Law enforcement now has the tools to end the reign of terror at clinics. The Freedom of Access to Clinic Entrances Act was uniquely crafted to provide federal law enforcement officials with the jurisdiction and penalties to combat the most threatening type of violence that clinics in this survey report: death threats.
Moreover, recent U.S. Supreme Court decisions upholding the use of RICO to prosecute concerted efforts to close clinics and upholding clinic buffer zones provide clinics and law enforcement officials at all levels strong tools to stem clinic violence. Vigorous investigation and prosecution of FACE and other local, state, and federal legal mechanisms is necessary to protect the lives of health care workers and women’s health care services.
APPENDIX A
Clinics Responding to Survey State-By-State
Alabama: 9
Alaska: 3
Arizona: 9
Arkansas: 7
Califomia: 35
Colorado: 8
Connecticut: 8
Delaware: 2
Florida: 25
Georgia: 7
Illinois: 9
Indiana: 6
Iowa: 4
Kansas: 3
Kentucky: 3
Louisiana: 2
Maine: 2
Maryland: 8
Massachusetts: 2
Michigan: 12
Minnesota: 4
Missouri: 2
Montana: 2
Nebraska: 3
Nevada: 1
New Hampshire: 3
New Jersey: 6
New Mexico: 3
New York: 19
North Carolina: 14
North Dakota: 1
Ohio: 14
Oklahoma: 2
Oregon: 4
Pennsylvania: 10
Rhode Island: 1
South Carolina: 2
South Dakota: 1
Tennessee: 6
Texas: 16
Utah: 2
Vermont: 7
Virginia: 7
Washington: 9
West Virginia: 1
Wisconsin: 6
Puerto Rico: 1
DC: 3
TOTAL: 314
APPENDIX B
State-by-State Analysis For 12 States Experiencing Highest Levels of Anti-abortion Violence
California
Eleven out of 35 clinics in California reported violent incidents during 1994. Seven clinics reported that their staffs were stalked during the first seven months of 1994. Also during the first seven months of 1994 were reports of home picketing and death threats by four clinics. Three clinics reported blockades and invasions and two clinics reported chemical attacks. Since 1993, five clinics reported an increase in death threats, and five clinics reported an increase in stalking. Two clinics reported an increase in chemical attacks since 1993, and two clinics reported an increase in invasions. One clinic each reported an increase in clinic blockades, clinic invasions, gunfire, and arson. Since the July murders 10 clinics reported a rise in death threats, stalking increased at five clinics, and clinic blockades increased at two clinics. FACE complaints were lodged by 11 clinics.
Florida
Twelve clinics from Florida participated in the survey. During the first seven months of 1994 four clinics reported home picketing and three reported stalking. One clinic was chemically attacked. One clinic each reported death threats, blockades, invasions, and gunfire. Since 1993, three clinics reported an increase in stalking and death threats. Blockades, bombings, and gunfire rose at two clinics and home picketing, invasions, and chemical attacks were reported as rising by one clinic per category. Since the July murders, death threats rose at two clinics and one clinic each reported a rise in stalking and bomb threats. FACE complaints were lodged by three clinics.
Illinois
Nine clinics in Illinois reported anti-abortion violence. During the first seven months of 1994, two clinics reported receiving death threats. Clinic staff at one clinic reported clinic blockades, and staff at another clinic were stalked during the same time period. Two clinics reported an increase since 1993 in bombings, and one clinic each reported an increase in death threats, stalking, clinic blockades, gunfire, and arson. Since the July murders two clinics reported an increase in death threats, and staff at four other clinics reported either being stalked, receiving death threats, receiving arson threats, or surviving an arson attack. None of these Illinois clinics filed a FACE complaint
.Indiana
Six clinics in Indiana responded to the survey. During the first seven months of 1994, three clinics reported stalking and home picketing, two reported death threats, and one reported being attacked by gunfire. Since 1993, two clinics reported an increase in stalking; two clinics reported an increase in death threats; and one clinic reported an increase in gunfire. Since the July murders two clinics reported a rise in death threats, and one clinic each reported an increase in stalking and clinic blockades. FACE complaints were filed by one clinic.
Michigan
Of the twelve clinics that responded to the survey in Michigan, three were blockaded; staff from two were stalked, another two had staff that were picketed at home, one clinic was invaded; and another reported receiving death threats. Since 1993, one clinic reported an increase in blockades, another reported an increase in stalking, and a third reported an increase in gunfire attacks. Since the July murders one clinic each reported an increase in chemical attacks, stalking, invasions, and death threats. Two clinics filed FACE complaints.
Missouri
Only two clinics from Missouri responded to the survey. These clinics, however, have experienced a range of anti-abortion violence including blockades, invasions, chemical attacks, home picketing, stalking and death threats, all in the first seven months of 1994. Furthermore, the clinics reported a rise in chemical attacks and bombings since 1993. They also reported a rise in invasions and death threats since the Pensacola murders in July.
New York
Nineteen clinics in New York completed the survey. Within the first seven months of 1994, five clinics reported home picketing, four reported clinic invasions, three reported death threats, two reported chemical attacks, two reported stalking, and one reported gunfire attacks. Since 1993, four clinics reported an increase in bombings, and one clinic each cited an increase in chemical attacks, stalking, invasions, and home picketing. Since the July slayings, death threats increased at three clinics and bomb threats at one clinic. Only one clinic reported a potential FACE violation.
North Carolina
Of the fourteen clinics that responded to the survey in North Carolina, four reported receiving death threats, three reported clinic invasions, and one each reported being targeted by blockades, home picketing, and stalking. Since 1993 two clinics reported a rise in death threats, two clinics reported an increase in stalking and one clinic reported an increase in home picketing. Three clinics reported an increase in death threats since the Pensacola slayings. Two clinics reported an increase in stalking and bomb threats, and one clinic each reported an increase in arson threats and invasions. FACE complaints were filed by one clinic, to which law enforcement officials responded.
Pennsylvania
In Pennsylvania three of the ten clinics that responded to the survey reported clinic blockades during the first seven months in 1994. One clinic was invaded, one clinic reported home picketing, one reported death threats, and one reported gunfire attacks. Since 1993, three clinics reported an increase in bombings, and one clinic each reported an increase in blockades, stalking, gunfire, invasions, and death threats. Since July, one clinic reported an increase in death threats and one clinic reported an increase in bomb threats. Only one FACE complaint was filed.
Texas
In Texas, five of the sixteen clinics in the survey reported death threats to staff during the first seven months of 1994. Four clinics experienced invasions, staff from four clinics experienced home picketing, two clinics reported blockades. One clinic was chemically attacked, a second was fired upon, and staff from a third clinic reported being stalked. Since 1993, clinics in Texas reported that blockades, chemical attacks, stalking, gunfire, invasions, death threats and home picketing rose. Since the July murders one clinic reported a rise in death threats. Two clinics filed FACE complaints.
Virginia
Of the seven clinics in Virginia who responded to the survey, four have staff who experienced home picketing, three have staff who were stalked, four clinics received death threats and one was blockaded. Two clinics reported a rise in death threats since 1993, and one clinic in each category of bombings, arson and home picketing reported an increase. Since July, the rate of death threats increased for two clinics and one clinic each reported a rise in bombings and arson attacks. Only one clinic reported a FACE violation to federal authorities.
Wisconsin
Six clinics from Wisconsin responded to the survey. Of these, five had staffs who experienced home picketing, three clinics had staff who were stalked, three clinics received death threats, three were blockaded and one was chemically attacked. Two clinics reported a rise in death threats since 1993, and two clinics reported a rise in home picketing. One clinic reported a rise in stalking. Since the July slayings two clinics reported an increase in death threats. A FACE complaint filed in Wisconsin resulted in the conviction of clinic blockaders.