FEMINIST MAJORITY FOUNDATION
METHODOLOGY
For the third consecutive year, the Feminist Majority Foundation conducted a nationwide survey of anti-abortion violence that occurred during the first seven months of 1995. In September of 1995, surveys were mailed to 902 clinics in the United States, and American Somoa. Follow-up phone calls to clinics were made in September and October. Surveys were completed by 310 clinics, producing a response rate of 34%. Data were analyzed using SPSS-X (Statistical Package for the Social Sciences) uni-variate and bi-variate statistical techniques. This annual survey represents one of the most comprehensive studies of anti-abortion violence directed at clinics, patients, and health care workers.
The sample of 310 clinics in the 1995 survey includes facilities in 44 states and American Somoa. (See Appendix A for list of number of clinics per state.) The percentage of clinic practice devoted to abortion ranges from less than 5% to over 75%. Clinics represented in the sample are almost evenly divided among facilities that are non-profit (31%), for profit (38.1%), and private doctors offices (30%).
Many of these clinics provide a wide range of gynecological and other health care services. The 1995 survey found that 94.8% of clinics provide health services in addition to abortion. Clinics provide birth control (92.6%), cancer screening (68.1%), pre-natal care (24.8%), menopause treatment (58.1%), tubal sterilization (29.7%), adoption and referral services (22.3%), infertility treatment (26.8%), PMS Treatment (51.6%), AIDS Testing (60%), reproductive health counseling (83.2%), pregnancy counseling (86.8%), and STD testing and treatment (82.3%).
Clinics that responded to the survey were assured that their individual responses would remain confidential. Clinics are identified by name or state only if the incidents and consequences of the violence are a matter of public record or if the Feminist Majority Foundation was given permission to include the details of the incident in this report.
KEY FINDINGS
Levels of clinic violence in 1995 declined substantially. In 1995, 38.6% of clinics experienced one or more of the most severe forms of clinic violence, including death threats, stalking, bomb threats and bombings, chemical attacks, blockades, invasions, and arson and arson threats. This rate is down significantly from 51.9% of clinics in 1994 and 50.2% in 1993. The proportion of clinics experiencing one or more types of violence grew to 55.8% when home picketing, vandalism, and gunfire also were tabulated. In 1994, 66.7% of clinics experienced at least one of the twelve types of violence.
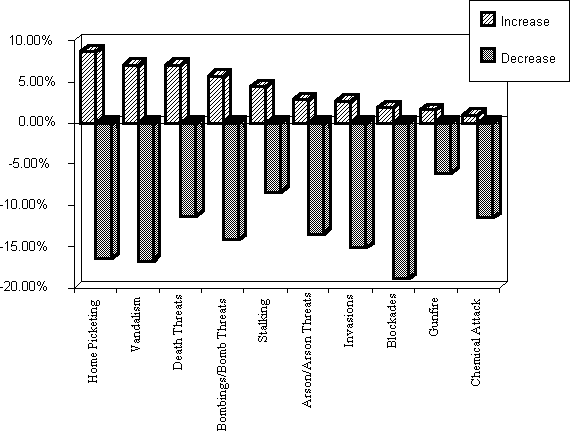
For the first time, in every category of violence, more clinics in 1995 reported decreases than increases in incidents. The smallest net decreases, however, were in reports of death threats and stalking.
Violence directed at individual physicians and clinic staff members continued at unacceptably high levels. Almost one in five clinics (17.1% ) reported death threats in 1995; one in five (20.3%) reported home picketing; and one in ten (10.6%) said clinic staff had been stalked.
Violence directed at physicians and clinic staff has taken its toll. Clinic staff resignations as a result of anti-abortion violence remained at 1994 levels, with almost one in ten (9%) of clinics having lost clinic staff for this reason. The majority (60.7%) of violence-related staff resignations occurred as a result of the December 30, 1994 murders of clinic workers in Brookline, Massachusetts.
One in five clinics reported violations of the Freedom of Access to Clinic Entrances Act to federal law enforcement officials, representing an increase from 16.5% in 1995. The majority (54.8%) of clinics reporting FACE violations were directed by federal authorities to seek assistance from local and state laws and law enforcement officials.
Decreases in clinic violence corresponded with law enforcement response. Local, state, and federal law enforcement officials won higher marks from clinics for their response to anti-abortion violence in the 1995 than in 1994. The greatest improvement in law enforcement response was seen at the local level, where 34.5% of clinics reported enforcement efforts had improved.;Clinic demands for legal remedies from the courts experienced mixed success. In 1995, 15.2% of clinics sought judicial relief from clinic violence, but less than half (46.8%) actually obtained the legal remedy sought. Over one-third (35.5%) of clinics are now protected by a buffer zone or civil injunction.
RESULTS
Anti-Abortion Violence Declines in 1995; One-third of Clinics Still Under Serious Attack
One year after passage of the Freedom of Access to Clinic Entrances Act and a U.S. Supreme Court ruling allowing the creation of “buffer zones” around women’s health care clinics, the level of violence at abortion clinics has declined significantly. However, over one-third of clinics remained under serious attack by anti-abortion forces during the first seven months of 1995.
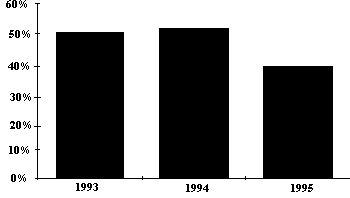
In 1995, 38.6% of clinics experienced one or more of the most severe forms of clinic violence. Types of violence included death threats, stalking, bomb threats and bombings, chemical attacks, blockades, invasions, and arson threats and arson attacks. This level of violence represented a drop of 13.3 points from 51.9% of clinics in 1994 and a drop of 11.6 points from 50.2% in 1993. (See Chart 1.)
Chart 1. Clinics Experiencing One or More Types of
Anti-Abortion Violence, 1993-1995
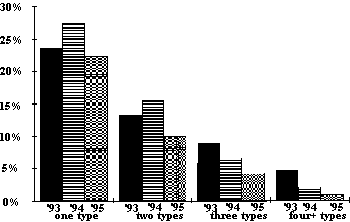
As Chart 2 shows, 22.3% of clinics in 1995 experienced one type of violence, 10% reported two types, 4.2% were the targets of three types of violence, and .9% experienced four or more types of violence. Chart 2 also compares 1995 levels of violence with 1993 and 1994.
Chart 2. Levels of Anti-Abortion Violence, 1993-1995
Both the 1995 and 1994 surveys also measured additional types of violence: vandalism, home picketing, and gunfire. When these variables are incorporated, the percentage of clinics that experienced violence in 1995 grows to 55.8%. In 1994, 66.7% of clinics were the targets of one or more of these ten types of violence.
Collapsing the twelve violence variables into three levels of violence further revealed the decline in intensity of violence between 1995 and 1994. In 1995 14.2% of clinics were heavily targeted experiencing a high level of violence (3 or more types), compared with 22.2% in 1994. In the 1995 survey, 41.6% reported a moderate level of violence (1 or 2 types); 44.5% experienced moderate levels of violence in 1994. In 1995, 44.2% of clinics had not experienced any of these types of violence; one third (33.3%) of clinics in 1994 indicated they had not faced anti-abortion violence.
Violent acts against clinics and health care workers were nationwide. The survey, however, revealed especially severe anti-abortion violence in Alabama, California, Colorado, Florida, Kansas, Massachusetts, North Dakota, North Carolina, Oklahoma, Oregon, Texas, and Wisconsin.
Death Threats, Home Picketing, and Stalking Still Terrorize Many Physicians and Clinic Workers
While overall clinic violence decreased in 1995, the types of violence that target physicians at their homes and offices remained at high levels. Almost one in five clinics (17.1%) reported death threats in 1995; one in five (20.3%) reported home picketing; and one in ten (10.6%) said clinic staff had been stalked. While these reports of death threats, stalking, and home picketing also represented declines since 1994, this violence still posed a significant threat to abortion providers. (See Chart 3)
Chart 3. Violence Reported By Type During First Seven Months of 1995
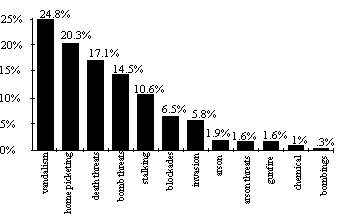
Relatively few clinics in 1995 reported blockades (6.5%), invasions (5.8%), or chemical attacks (1%). Bomb threats were reported by 14.5% of clinics. Vandalism was the most highly reported type of violence, with almost one-fourth (24.8%) of clinics reporting that their facilities had been vandalized. Acts of vandalism included glue in door locks (5.2%), nails in clinic driveways or parking lots (2.9%), motor oil in parking lot (1.9%), paint on building (8.1%), and broken windows (9.4%). Other forms of vandalism included destruction of property and landscaping, disposal of trash on clinic property, placement of locks on clinic doors and gates, and tampering with clinic utilities such as electricity and water.
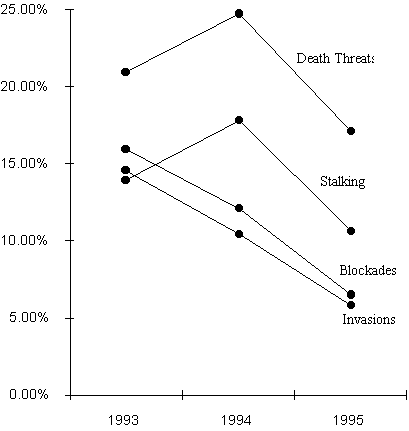
Facing the mobilization of abortion rights activists at clinics, protest injunctions, and buffer zones, anti-abortion extremists largely have abandoned clinic blockade and clinic invasion strategies in favor of more threatening strategies aimed at particular physicians and clinic workers such as death threats, stalking, and home picketing. Chart 5 illustrates the patterns of decline in various types of violence over the past three years, based on our annual surveys.
Chart 4. Clinic Reports of Blockades, Invasions, Death Threats and Stalking, 1993-1995
For the first time, in every category of violence, more clinics in 1995 reported decreases than increases in incidence. Chart 5 reveals reported increases and decreases in specific types of violence in 1995, compared with 1994. Significantly, however, the smallest net decreases occurred in death threats and stalking.
Chart 5. Increases and Decreases in Types of Violence
During First Seven Months of 1995
One in Ten Clinics Lose Staff as a Result of Anti-Abortion Violence
Clinics continued to lose staff as a result of ant-abortion violence. In 1995, 9% of clinics reported that staff members had quit as a result of anti-abortion violence and harassment. A similar number of clinics reported violence-related resignations in 1994. Both 1994 and 1995 levels of staff resignations represented a major decline from 1993, when one-fourth of clinics said they had lost staff members because of fears of violence.
Clinics which were the most heavily besieged by violence were the most likely to lose staff members. Of the clinics experiencing high levels of violence, 13.6% said staff members had resigned, compared with 9.3% of clinics reporting moderate violence and 7.3% of clinics reporting no violence.
The murder of two clinic workers and shooting of five other people in Brookline, Massachusetts on December 30, 1994 sent shockwaves through the nation. The attacks especially intensified fear among staff members at clinics around the country. Over sixty percent (60.7%) of clinics which reported staff losses as a result of violence in 1995 said those staff members had quit as a direct result of the Brookline murders.
One In Five Clinics Reported FACE Violations
One in five clinics (20%) surveyed said they had reported violations of the Freedom of Access to Clinic Entrances Act (FACE) to federal law enforcement officials – an increase in reports from 16.5% in 1994.
Enacted in May of 1994, FACE makes anti-abortion violence a federal crime. The Act provides federal jurisdiction and enacts specific federal penalties, including felony offenses and civil fines, for those convicted of using force, the threat of force, or physical obstruction against patients, health care workers, and clinics.
The federal government’s enforcement of FACE increased substantially in 1995. According to the Department of Justice, the first full year of FACE implementation resulted in 133 criminal civil rights investigations, 15 indictments, and 15 convictions. Nine FACE civil actions were brought by the federal government. In 1995, the U.S. Supreme Court also rejected the American Life League’s challenge to the constitutionality of FACE.
Key events in FACE enforcement in 1995 included the conviction of Paul Hill for the 1994 murders of Dr. John Bayard Britton and clinic escort James Barrett and shooting of June Barrett. A possible murder of a physician was averted in August of 1995 when the FBI arrested Robert Cook, an anti-abortion extremist, who allegedly robbed an armed car of $260,000 and planned to use the money to Òfund a war against abortion.Ó Cook was arrested just days before he planned to start his war by killing an abortion doctor. Cook was convicted of FACE violations as well as larceny, money laundering, and solicitation.
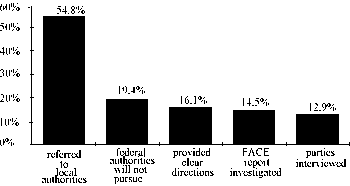
While FACE enforcement steadily improved in 1995, federal officials were still reluctant to use FACE to address many instances of clinic violence. The 1995 survey found that the majority of FACE reports that clinics made to federal officials were referred to local law enforcement officials. Of the 62 clinics making FACE reports, 54.8% were told their claims should be handled under local and state laws. Almost one-fifth (19.4%) of clinics reporting FACE violations said that they were advised that federal authorities would not prosecute. Only 16.1% of clinics that reported FACE violations said that law enforcement officers provided clear directions for initiating formal FACE complaints. Only 14.5% of clinics reported that their FACE reports were formally investigated and just 12.9% said involved parties were officially interviewed. (See Chart 6.)
Very few clinics reporting FACE violations said their reports had resulted in civil or criminal action under the federal law. Reported FACE violations resulted in FACE criminal proceedings for only 8.1% of clinics. Only 4.8% of clinics that reported FACE violations pursued FACE civil action. U.S. attorneys initiated FACE complaints for 8.1% (25) of the clinics. Of the clinics surveyed, one won a FACE civil suit, three won FACE injunctions, and one clinic won FACE criminal charges.
For profit clinics were more likely than non-profit clinics or private doctors offices to report FACE violations. In 1995, 43.5% of FACE violations were reported by for profit clinics, with non-profit clinics accounting for 30.6% and private doctors offices accounting for 24.2% of FACE reports. This pattern represents a shift from the 1994 data which showed far more non-profit clinics than for profit or private doctors office facilities reporting violations of FACE.
Chart 6. Federal Law Enforcement Responses to FACE Violation Reports
The majority (60.6%) of clinics said that they had been informed by federal authorities of the appropriate FACE contact in the U.S. Attorneys office in their districts.
Law Enforcement Response Improved in 1995
Local, state, and federal law enforcement officials won higher marks from clinics for their responses to anti-abortion violence in the 1995 than in 1994. Local law enforcement response was ranked as “excellent” by 43.9% of clinics in 1995, with 32.3% calling local law enforcement response “good,” and 8.7% of clinics reporting “poor” responses. In 1994, 30.3% of clinics reported that local law enforcement response was ‘excellent;” 35.4% said local response was “good;” and 11.5% of clinics experienced local response as “poor.”
Federal law enforcement received significantly higher ratings from clinics in 1995 than in 1994. Of the clinics, 20.3% reported “excellent” federal response in 1995, with 31% of clinics saying federal response was “good” and 12.9% stating they had experienced a “poor” response from federal officials. In 1994, only 10.5% of clinics had reported an “excellent” response from federal law enforcement, 21.3% said the federal response was “good” and 8% characterized federal response as “poor.”
Clinics ranked state law enforcement response lower. State law enforcement response was identified as by 15.5% of clinics as excellent, 24.5% as good, and 8.1% as poor. These results, however, showed significant improvement in state response since 1994, when 7.3% of clinics reported state response as excellent, 15.9% as good, and 8.9% as poor.
The 1995 survey results also suggested that clinics were interacting more with law enforcement officials at all levels than in the past. In 1995, only 15% of clinics responded “don’t know” to questions abou local law enforcement response, compared with 22.9% in 1994. Slightly over one half of clinics (51.9%) were unable to describe state law enforcement response to clinic violence, but this still represented improvement since 1994 when 67.8% could not characterize state enforcement efforts. Similarly, 35.8% of clinics in 1995 responded “don’t know” when asked to rank federal law enforcement response, compared with 60.2% in 1994.
Another measure found a significant number of clinics in 1995 interacted with federal officials. Over two-thirds (68.1%) of clinics reported that they had been contacted by U.S. marshals about clinic violence.
Most clinics reported little change in local, state, or federal response to clinic violence when asked to compare 1995 levels of response with their experiences in 1994. The plurality of clinics said local (46.1%), state (40.6%), and federal (42.3%) response Òremained the sameÓ as in the previous year. Very few clinics reported that law enforcement response at any level had declined.
Clinics reported the most improvement in local law enforcement response, followed by federal response. Of the clinics, 34.5% said local law enforcement response had “improved,” while 26.5% noted improvements in response from federal law enforcement. 17.7% of clinics said state law enforcement response had “improved.”
Levels of Violence Correlate with Law Enforcement Response
A clear relationship between clinic violence and law enforcement response emerged from the 1995 survey data. Only 11% of clinics reporting excellent local law enforcement experienced high levels of violence, compared with 33.3% of clinics who reported poor law enforcement response.
A similar pattern appeared in relation to state law enforcement response. Of those clinics experiencing a poor state law enforcement response, 28% report high levels of clinic violence; only 14.6% of clinics reporting excellent state law enforcement response experienced high levels of violence.
Death threats, in particular, are consistently related to local, state, and federal law enforcement response. Better law enforcement response corresponded with fewer death threats. Bombings/bomb threats, vandalism, and death threats had statistically significant relationships with federal law enforcement response. Statistically significant relationships also were found between local law enforcement response and death threats, stalking, vandalism, blockades, and invasions. Stalking and death threats were the only two types of violence that correlated with state law enforcement response at a significant level.
Another indication of law enforcement response was the number of clinics that reported arrests and whether charges were filed in these cases. Only 13.8% (43) of clinics reported arrests as a result of violence at clinics. Of the clinics, 11.6% (36) reported misdemeanor arrests or arrests for violation of local ordinances; 1.6% (5) reported felony arrests; and .6% (2) reported both misdemeanor/felony.
Arrests were clearly related to the levels of violence experienced by clinics. Clinics that experienced higher levels of violence indicated more arrests regardless of whether the violent acts took place at or away from clinics. Over one third (36.3%) of the clinics that experienced a high level of violence reported arrests for felonies and misdemeanors committed at clinics. Only 14.7% of clinics affected by moderate levels of violence reported arrests for anti-abortion activities at the clinics. Of the clinics that reported high levels of violence, 11.4% noted either felony or misdemeanor arrests related to violence that took place away from clinics. Only 3.9% of clinics that reported moderate levels of violence also indicated arrests for conduct away from clinics.
Approximately one-third of clinics that reported misdemeanor and local ordinance arrests also indicated that charges were filed as a result of the arrests. Of the 36 clinics reporting misdemeanor/local ordinance arrests related to anti-abortion violence at clinics, 33.3% said charges were filed and another 5.6% said charges were filed in some cases, but not others. Of the 8 clinics that reported misdemeanor/local ordinance arrests related to anti-abortion violence targeted at physicians and staff away from clinics, 37.5% said charges were filed. All of the clinics that reported felony arrests said charges were filed. One of the two clinics that reported both felony and misdemeanor arrests related to violence at clinics said charges were filed.
Less Than Half of Clinics Won Legal Protections
Over one-third (35.5%) of clinics are currently protected under civil injunctions or buffer zones.
In 1995, 15.2% of clinics turned to the courts to seek relief from clinic violence. Of the clinics, 3.2% sought temporary injunctions, 5.8% permanent injunctions, and 4.2% restraining orders.
Only 46.8% of clinics who sought legal remedies actually obtained the desired protection. Clinics in 1995 were less successful than in 1994 in winning restraining orders and temporary injunctions to protect themselves from clinic violence. In 1995, 46.2% of the clinics requesting temporary restraining orders against anti-abortion extremists won restraining orders, compared with 68.8% in 1994. Fifty percent of clinics who sought temporary injunctions in 1995 won those injunctions, in comparison to 62.5% of clinics in 1994.
On the other hand, clinics in 1995 were extremely successful in obtaining permanent injunctions. All but 5 of the 18 clinics that sought permanent injunctions won those injunctions, for a total of 72.2%. In 1994, only 27.8% of clinics seeking permanent injunctions won that legal remedy.
CONCLUSIONS
Levels of clinic violence in 1995 declined substantially. Fewer clinics reported incidents of death threats, stalking, home picketing, vandalism, chemical attacks, blockades, arson and arson threats, invasions and gun fire. In every category of violence, more clinics reported decreases than increases.
Violence directed at individual physicians and clinics staff members, however, continues at unacceptably high levels. Almost one-fifth (17.1%) of clinics reported death threats in 1995. A similar proportion (20.3%) of clinics indicated that the homes of clinic staff and physicians had been picketed. One in ten (10.6%) clinics said staff and physicians had been stalked by anti-abortion extremists. Of all the types of violence, death threats had the smallest net decrease in 1995.
And these types of violence have taken their toll on clinic staff. One in ten clinics still report that staff members have quit as a result of anti-abortion violence. The murders of clinic staff in Brookline Massachusetts by John Salvi accounted for almost two-thirds of these resignations.
Decreases in clinic violence were tied directly to law enforcement response. The survey found statistically significant correlations between levels of violence and local, state, and federal law enforcement response. The level of death threats appeared to be particularly sensitive to law enforcement activities. Death threats were the only type of violence in which a statistically significant relationship was indicated with local, state, and federal law enforcement activities.
Clinics consistently reported that law enforcement at the local, state, and federal levels had improved. These improvements without question have helped diminish anti-abortion violence overall. However, clinics also reported that implementation of the Freedom of Access to Clinic Entrances Act has not been as vigorous as it could be. Although one in five clinics reported FACE violations, very few of these reports resulted in criminal or civil action. Enforcement of FACE and the increased involvement of federal and state as well as local officials clearly is necessary to end the serious violence which continues to plague a significant proportion of clinics in the United States.
APPENDIX A
Clinics Responding to Survey State-by-State
Alabama: 7
Arizona: 10
Arkansas: 3
California: 41
Colorado: 5
Connecticut: 10
Florida: 24
Georgia: 4
Illinois: 5
Indiana: 5
Iowa: 5
Kansas: 5
Kentucky: 1
Louisiana: 4
Maine: 2
Maryland: 9
Massachusetts: 5
Michigan: 16
Minnesota: 5
Mississippi: 1
Missouri: 2
Montana: 3
Nebraska: 1
Nevada: 4
New Hampshire: 3
New Jersey: 8
New Mexico: 2
New York: 22
North Carolina: 10
North Dakota: 1
Ohio: 16
Oklahoma: 2
Oregon: 5
Pennsylvania: 7
Rhode Island: 2
South Carolina: 2
South Dakota: 1
Tennessee: 6
Texas: 17
Utah: 2
Vermont: 5
Virginia: 5
Washington: 9
Wisconsin: 5
American Samoa: 1
Total: 310
APPENDIX B
State-by-State Analysis For Twelve States With Highest Levels of Anti-abortion Violence During the First Seven Months of 1995
Alabama
Four of the seven Alabama clinics received death threats. Three clinics received bomb threats. One clinic received an arson threat. Three clinics were vandalized. One clinic reported staff members had been picketed at home. Three clinics reported stalking. One clinic said staff had quit as a result of anti-abortion violence. Four clinics reported FACE violations. One clinic is protected by an injunction or buffer zone.
California
Only four out of forty-one clinics in California reported blockades. Three clinics faced invasions. Nine clinics received bomb threats. Two clinics experienced arson. Twelve clinics experienced vandalism. Four clinics reported home picketing. Four clinics reported death threats. One clinic reported gunfire. Two clinics reported violence-related staff resignations. Six clinics informed authorities of FACE violations. Six clinics said they were protected by buffer zones or injunctions.
Colorado
One of the five clinics in Colorado was invaded during the first seven months of 1995. A bomb threat was received by one clinic. Two clinics were vandalized. One clinic said staff experienced home picketing. Two clinics reported staff members had been stalked. Two clinics reported death threats. Two clinics lost staff as a result of violence. Two clinics told federal authorities of FACE violations. One clinic reported a suit for civil damages had been filed under FACE. Two clinics said they had buffer zones or injunctions.
Florida
Only one of twenty-four clinics in Florida reported blockades. One clinic received a bomb threat. One clinic was set on fire. Four clinics reported vandalism. Three clinics reported home picketing. Two clinics reported that staff members had been stalked. Four clinics received death threats. One clinic reported staff resignations as a result of clinic violence. Four clinics reported FACE violations. Buffer zones or injunctions are in place at nine clinics.
Kansas
One of the five Kansas clinics experienced arson. Two clinics were vandalized. Two clinics said staff were picketed at home. Two clinics reported stalking. Three clinics received death threats. One clinic informed federal authorities of FACE violations. One clinic reported a FACE civil suit had been filed. One clinic reported FACE criminal charges had been filed. One clinic has a buffer zone or injunction.
Massachusetts
Three of the five Massachusetts clinics reported bomb threats. One clinic reported home picketing. Staff members at two clinics were stalked. Death threats were received by three clinics. One clinic reported gunfire. One clinic reported staff members had quit as a result of anti-abortion violence. One clinic reported FACE violations. Five clinics are protected under an injunction.
North Carolina
Three out of the ten North Carolina clinics experienced blockades in the first seven months of 1995. Two received bomb threats. Four clinics were vandalized. Three clinics reported staff members had been picketed at home. Two clinics had staff members who had been stalked. Four clinics reported death threats. Four clinics told federal authorities of FACE violations. Two clinics reported FACE criminal charges had been filed. Two clinics are protected by buffer zones or injunctions.
North Dakota
The lone North Dakota clinic reported home picketing, death threats, and stalking. The clinic also reported FACE violations to federal officials. A buffer zone or injunction was in place at the clinic.
Oklahoma
One of the two clinics from Oklahoma in the sample was hit by a blockade. One clinic was vandalized. One clinic said staff were picketed at home. Staff members of one clinic were stalked.
Oregon
One of the five Oregon clinics reported a blockade. Two clinics were invaded. One clinic experienced vandalism. All five clinics reported picketing at the homes of staff members and physicians. One clinic reported death threats. One clinic reported staff had quit because of anti-abortion violence. FACE violations were reported at one clinic. One clinic reported FACE criminal charges had been filed. Four clinics have buffer zones or injunctions.
Texas
Only two out of seventeen Texas clinics experienced blockades. Four clinics reported invasions. Three received bomb threats. Four clinics were vandalized. Five clinics reported home picketing. Death threats were received by two clinics. One clinic reported gunfire. Two clinics said staff quit as a result of clinic violence. Three clinics reported FACE violations. Eight clinics are protected by buffer zones or injunctions.
Wisconsin
One clinic in Wisconsin was invaded, and one received a bomb threat. Four of the five clinics were vandalized. Three clinics reported home picketing. Three clinics said staff members had been stalked. Three clinics reported death threats. FACE violations were reported at two clinics. One clinic reported FACE criminal charges have been filed. Four clinics have buffer zones or injunctions.
